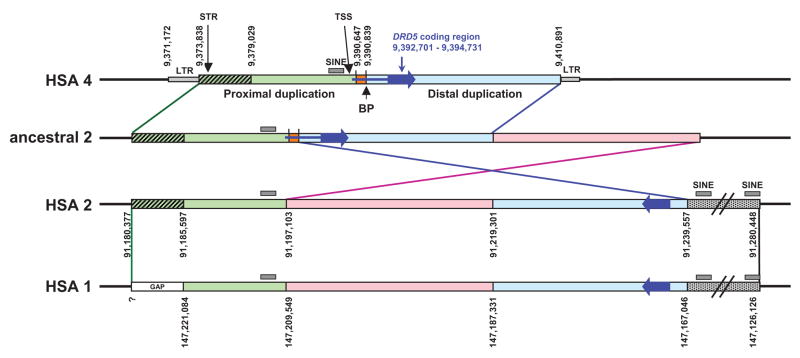
Figure 1.
Schematic representation of the segmental duplications (SD) surrounding DRD5. The large blue arrow represents the DRD5 coding region, the small blue line is the 5′ UTR. The positions of the TSS and the commonly used STR are indicated with arrows. Black lines represent unique sequence on each chromosome. The green box represents the proximal SD. The green hatched box represents homologous sequence between HSA4 and HSA2, however, this region is missing in the assembly of HSA1 (gap). The light blue box represents the distal SD, which exists in an inverted orientation to the proximal SD on HSA1 and 2. The orange box is unique sequence within the 5′ UTR which is not found in either SD. The pink box and the dotted gray box represent sequence that is homologous between HSA1 and 2 only. BP indicates the 5′ breakpoint between the distal duplication and HSA1 and 2 as described by Beischlag et al. (1995). Numbers represent nucleotide positions for each breakpoint as determined from the UCSC browser (March 2006 build).

