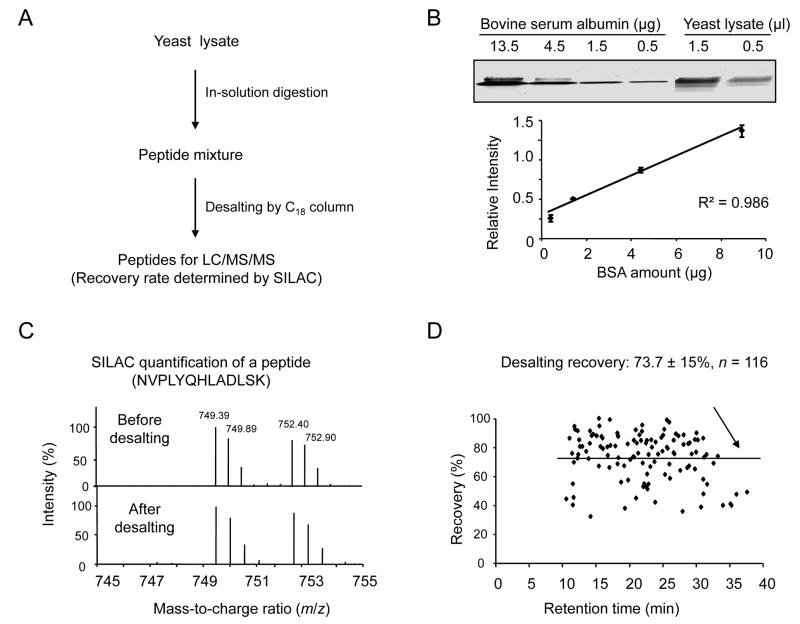
Figure 1.
Sample preparation for LC/MS/MS runs.
(A) Flow chart for quantifying protein and peptide used for optimization.
(B) Quantification of yeast lysate on a short 9% SDS gel with BSA as standard. The standard curve used for quantification was shown (n = 3).
(C) Peptide quantification by SILAC methodology. Same amount of peptides digested from heavy labeled yeast cells was spiked in the input and the elution fraction, and then analyzed by LC/MS/MS.
(D) Calculation of averaged peptide recovery from 116 peptides that are plotted according to retention time in LC/MS/MS. The value is shown as mean and standard deviation.

