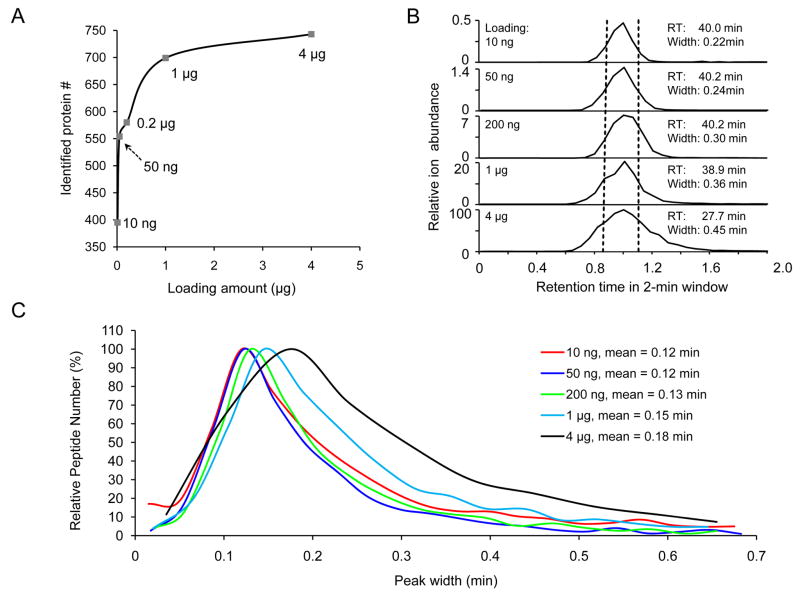
Figure 3.
Optimization of loading amount for protein identification.
(A) Protein identification was increased with higher loading amount but could be saturated. The loading amount of peptides was calculated based on quantified protein concentration and peptide recovery. Peptides were eluted in a 5–35% gradient of buffer B over 40 min.
(B) Sample loading amount affects ion intensity and peak width in LC. The TEF2 peptide (IGGIGTVPVGR) of high abundance was shown as an example, including ion intensity, retention time, peak width at half height. The ion intensity in all runs was normalized to the intensity in the 4 μg run (100% = 4.7E8, mass range 512.9–514.6 m/z). (C) Distribution of peak width at half height for accepted peptides. For each run, the peak width data were first filtered by ion intensity (at least 2 signal-to-noise ratio), then grouped into ~20 bins for plotting histogram. The mean was derived by fitting most of the data points to Gaussian distribution.

