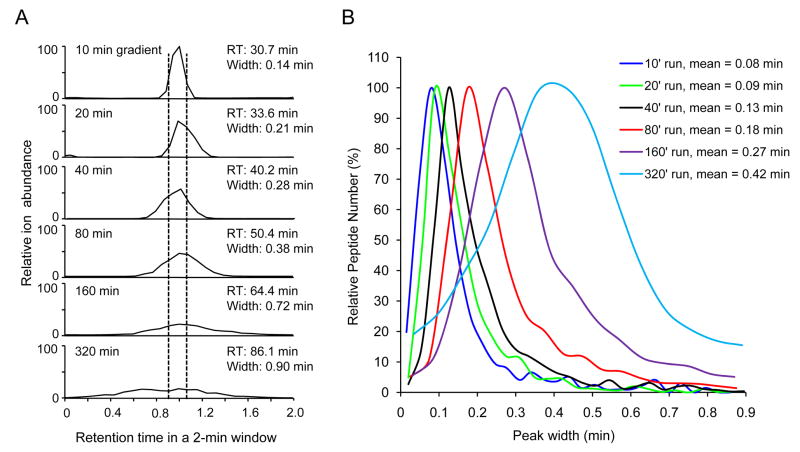
Figure 7.
Analysis of peak width with the same loading but different gradient length.
(A) Comparison of peak width and intensity of one eluted peptide in LC/MS/MS runs (50 ng loading, 10–320 min gradient). The peptide ion (IGGIGTVPVGR in protein TEF2) of high abundance was extracted from the 10-min run, and aligned with the same peptide peak from the other selected runs. The ion intensities of all runs were normalized to the result of the 10-min run.
(B) Distribution of peak width at half height for accepted peptides in a set of runs (50 ng loading, 10–320 min gradient). The peak width data were filtered by ion intensity (at least 2 signal-to-noise ratio), then grouped into ~20 bins for plotting histogram. The mean was derived by fitting most of the data points to Gaussian distribution.

