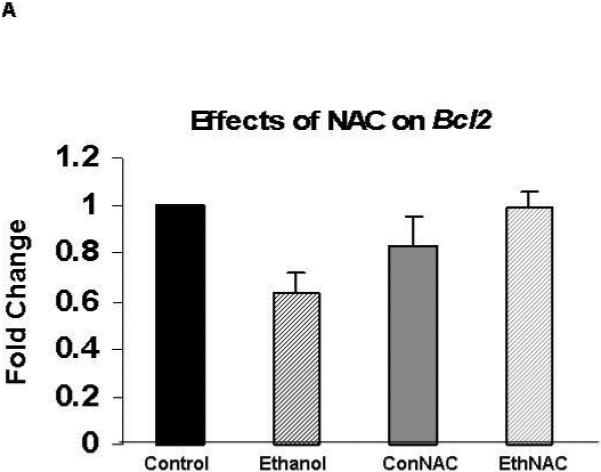
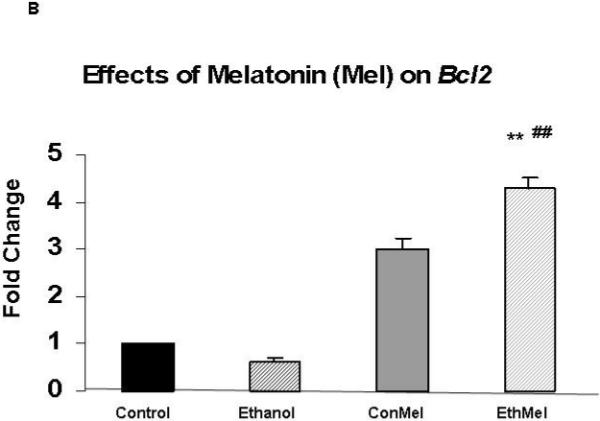
Figure 4. Co-treatment of ethanol-treated HN2-5 cells with melatonin augmented expression of XIAP.


Each value represents the mean ± the SEM of values obtained from three to four separate experiments obtained from cultures of HN2-5 cells that were co-treated with NAC (Figure 4A) or melatonin (Figure 4B). Values are expressed as the fold change in mRNA as calculated by the 2 -ΔΔCT method [Livak and Schmittgen, 2001]. The abbreviations Con, Eth, NAC and Mel are used in place of Control, Ethanol, N-acetylcysteine, and melatonin, respectively. The ** identifies values that are significantly different from the control value at p< .01; the ## identifies values in the EthMel group that are significantly different from those in the Ethanol group (p <. 01).
