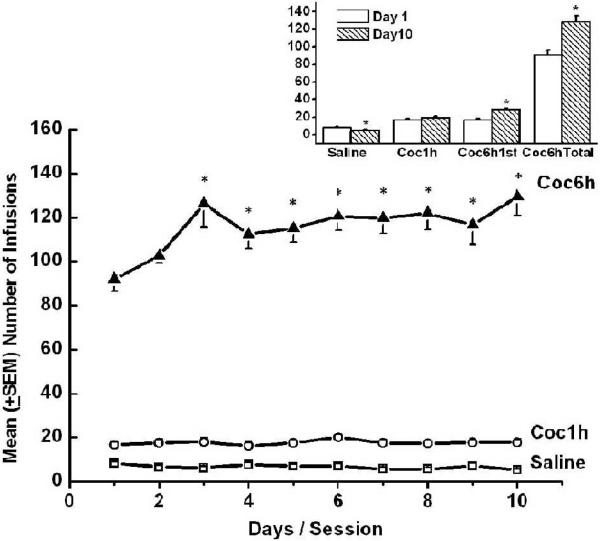
Figure 2.
Mean (+SEM) number of saline or cocaine self-administered infusions over days are depicted in the main graph. Significant increases in number of self-administered cocaine infusions in the first hour and over the whole session were observed in the Coc6h group by the third day. * Represents significant difference from the first day of testing (p < 0.01). Mean (+SEM) number of self-administered infusions on the first (open bars) and tenth (striped bars) day of testing for the saline, Coc1h, and Coc6h (first hour and whole session) is depicted in the inset graph. * Represents significant difference between first and tenth day of testing (p < 0.007).

