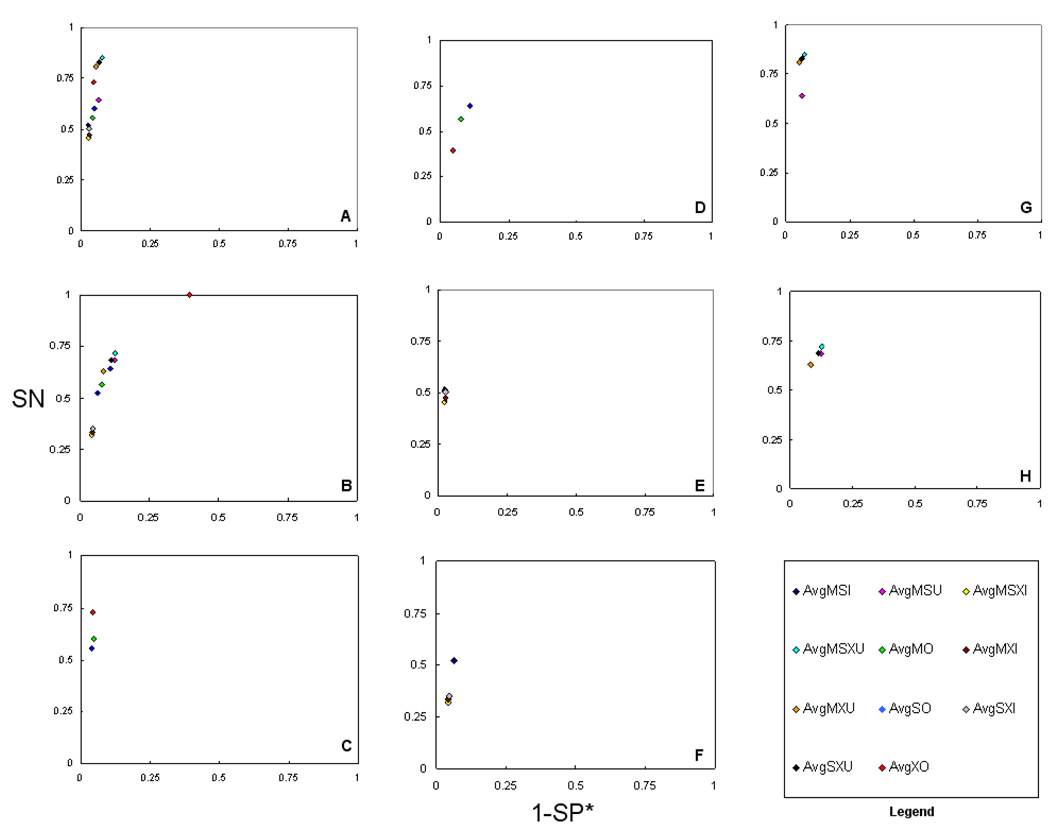
Figure 2.
ROC methods plots (SN vs. 1-SP*) of average of consensus methods (CMs) for two datasets. A) average of all CMs,10-protein, B) average of all CMs, 50-protein, C) average of individual CMs, 10-protein, D) average of individual CMs, 50-protein, E) average of intersection CMs, 10-protein, F) average of intersection CMs, 50-protein, G) average of union CMs, 10-protein, and H) average of union CMs, 50-protein. This figure illustrates the performance of the average Scaffold settings of all eleven consensus methods. It is notable that the AvgMSXU appears, overall, most accurate in terms of both SN and SP*. This result was reproducible across both data sets. A comparative accuracy was also observed for the AvgMXU methods. Among the individual methods, MO tended to more specific, and SO tended to be more sensitive. Another finding is that intersection consensus methods showed the highest specificity but at a notable reduction in sensitivity.

