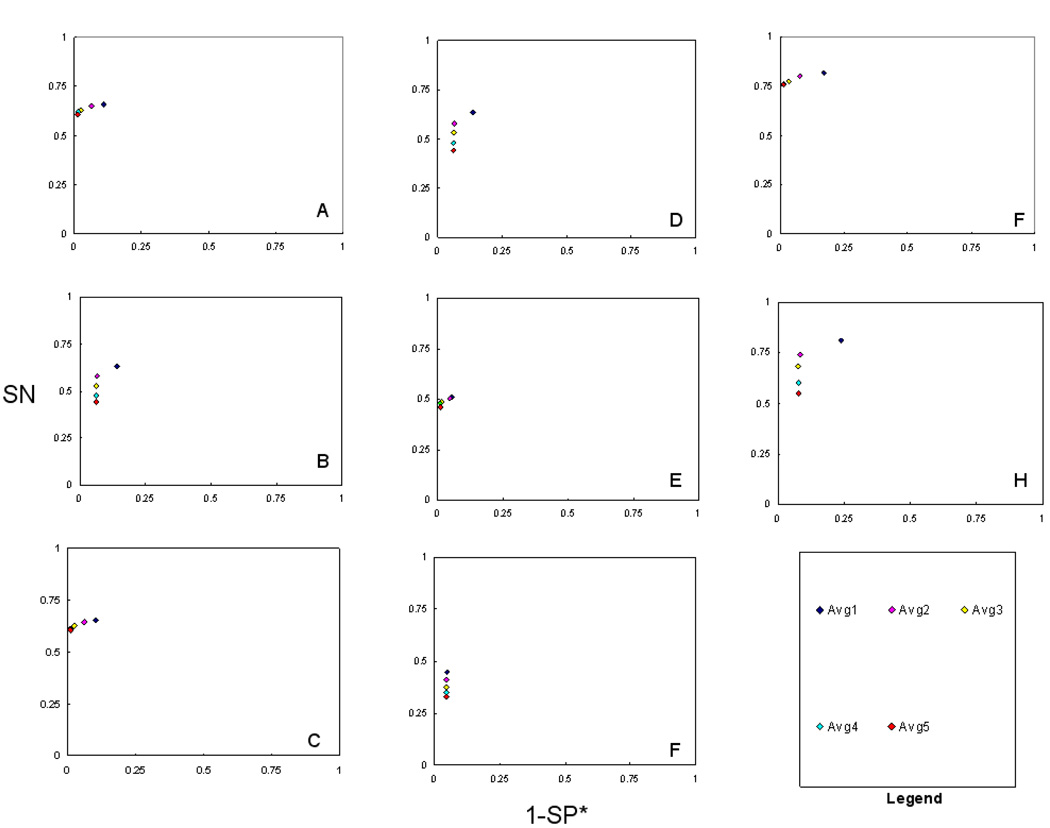
Figure 4.
ROC method plot (SN vs. 1-SP*) of average ‘minimum number of peptides’ for all consensus methods (CMs) tested. The ‘minimum number of peptides’ value refers to the number of unique peptides the protein identification is based on. The ‘minimum number of peptides’ values used were 1, 2, 3, 4 and 5. A–H) Same as figure 2. Individual and union CMs with minimum two peptides performed accurately in terms of SN and SP*. CMs with three to five minimum peptides were apparently more specific, but at a loss in sensitivity. The intersection CMs with one to two minimum peptides were more sensitive and those with three to five minimum peptides performed apparently more specific for the10-protein dataset. For the 50-protein dataset, the average intersection CMs with one to five minimum peptides performed similar in SP*. Average CM with one minimum peptide was found to have the highest SN for this dataset.

