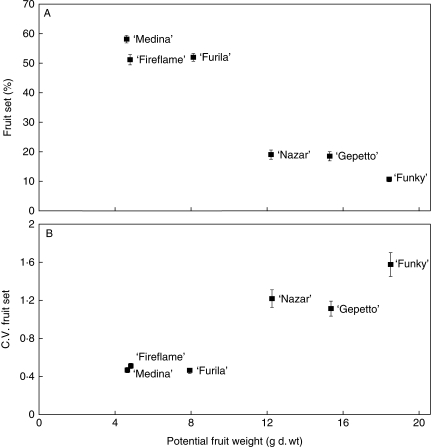
Fig. 2.
Relationship between (A) fruit set (%) and potential fruit weight (g dry matter), Spearman R = −0·93, P < 0·001, and (B) variations in weekly fruit set and potential fruit weight (g dry matter), Spearman R = 0·80, P < 0·001, of six cultivars. Variations in weekly fruit set were defined as the coefficient of variation (CV), calculated as the s.d. of weekly fruit set divided by average weekly fruit set. Error bars represent s.e. (n = 12) and are shown when larger than the symbol.

