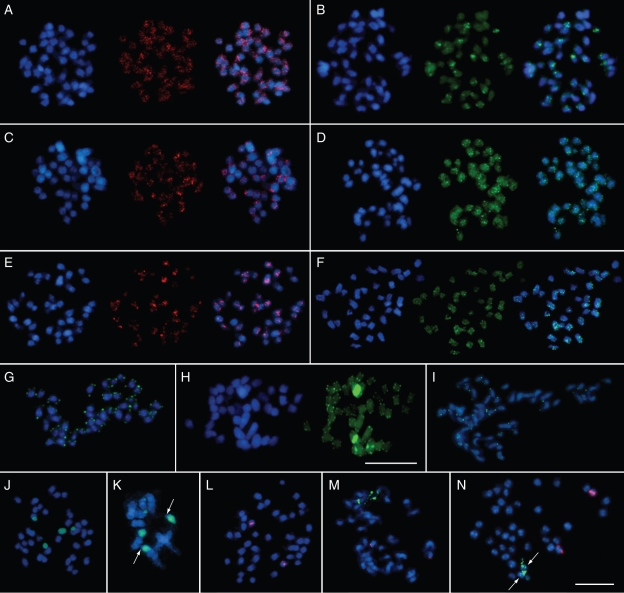
Fig. 5.
Fluorescence in situ hybridization to metaphase chromosomes of three Dendrobium species. In panels A–F, the DAPI-stained DNA (blue fluorescence) shows the morphology of the chromosomes. The images on the left show the dispersed distribution of the DmoF14 fragment on the chromosomes of D. moschatum (A), D. aphyllum (C) and D. aggregatum (E), in red fluorescence (middle and overlay image in each panel). The images on the right show the dispersed localization of the microsatellite DmoO11 on the chromosomes of D. moschatum (B), D. aphyllum (D) and D. aggregatum (F), respectively, as green fluorescence (middle and overlay image in each panel). (G–I) Chromosomal localization of the telomeric sequence DmoB22 (green fluorescence) on chromosomes of D. moschatum, D. aphyllum and D. aggregatum, respectively. The internal positions of telomeric sequence motifs on two pairs of D. aphyllum chromosomes are visible as bright yellow–green signals (H, right). (J–N) rDNA FISH analysis on D. moschatum (J, K and L), D. aphyllum (M) and D. aggregatum (N) metaphases. Red signals indicate 5S rDNA repeats and green signals represent 18S–5·8S–25S rRNA arrays. Terminal regions lacking 18S–5·8S–25S rRNA genes on one pair of D. moschatum chromosomes are indicated by arrows in a partial metaphase (K, close-up). The minor 18S–5·8S–25S rRNA site on two D. aggregatum chromosomes is shown by an arrow in N. The scale bar in N corresponds to 10 µm and is valid for all images except H containing an individual 10 µm scale bar.

