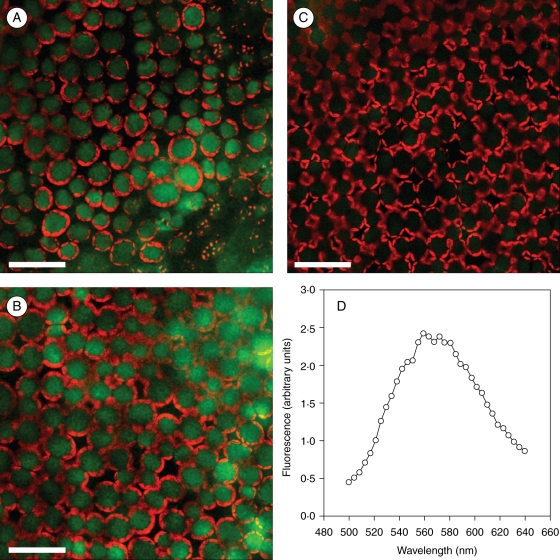
Fig. 5.
Images of the green and red fluorescence at a depth of 20 µm from the adaxial leaf surface of Ligustrum vulgare growing at different sunlight irradiance: (A) leaves exposed to 100 % natural sunlight over the 300–1100-nm waveband (PAR100 + UV); (B) leaves exposed to 100 % natural sunlight over the 400–1100-nm waveband (PAR100); (C) leaves exposed to 25 % natural sunlight over the 400–1100 nm waveband (PAR25). Measurements were performed on leaf pieces (approx. 25 mm2) infiltrated with 100 µL of NR. CLSM analysis performed in two-channel sequential mode: flavonoid fluorescence was recorded in the green channel (λexc = 488 nm, acquisition in the 560–600-nm band), and the chlorophyll fluorescence in the red channel (λexc = 514 nm, detection in the 670–750-nm band), respectively. (D) In vivo emission spectrum of blue-light excited (λexc = 488 nm) palisade cells of leaves in the PAR100 treatment. Fluorescence signal was integrated, in the λ-scan mode at 10-nm spectral resolution, over a 246 × 246 µm area. Scale bars = 50 µm.

