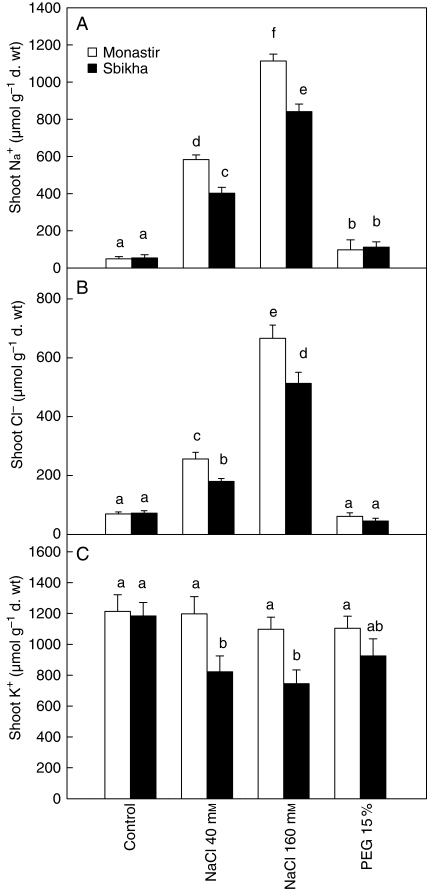
Fig. 4.
Sodium (A), chloride (B) and potassium (C) concentrations in the leaves of Atriplex halimus issued from a coastal saline site (Monastir) or an inland semi-arid area (Sbikha) and exposed for 10 d to control nutrient solution or to nutrient solution containing 40 or 160 mm NaCl or 15 % PEG in the absence or presence of 50 µm ABA in the nutrient solution. Measurements were performed on fully expanded leaves. Each value is the mean of 12 replicates and vertical bars are s.e. of the means. Values sharing a common letter are not significantly different at P < 0·05.

