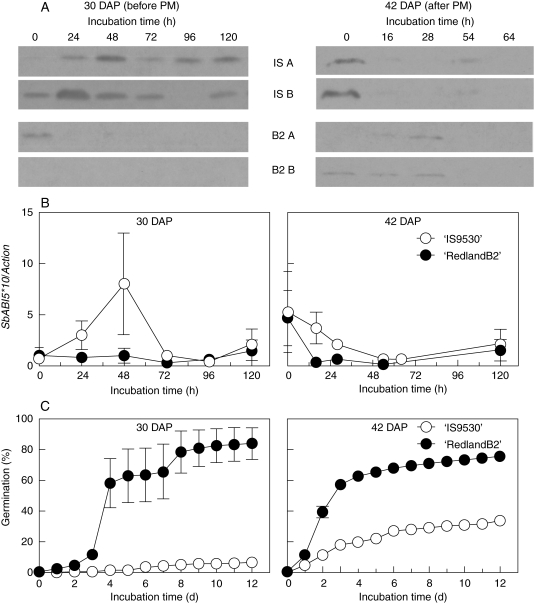
Fig. 4.
(A) Western blot showing ABI5 protein levels during incubation in water of grains of 30 DAP (before physiological maturity, PM) and 42 DAP (after PM) from ‘IS9530’ (dormant, PHS resistant) and ‘RedlandB2’ (less dormant, PHS susceptible) panicles. Caryopses were incubated at 25 °C and embryos were excised after different incubation times, and used for RNA and protein extraction. Biological replicates (‘A’ and ‘B’) for both genotypes are shown and belong to different field plots. (B) SbABI5 transcript levels relative to SbActin. (C) Germination response for ‘IS9530’ and ‘Redland B2’ grains used in the experiments above. Horizontal bars indicate the sampling period for RNA and proteins. Data in (A), (B) and (C) were all obtained from the same samples. Each data point in (B) and (C) is the mean of two biological repetitions (two field plots).

