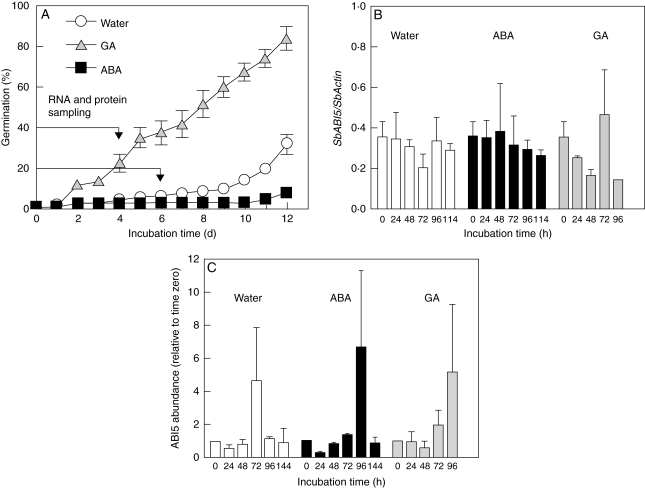
Fig. 5.
Germination response (A), SbABI5 mRNA levels relative to SbActin (B) and ABI5 protein levels (C) in embryos dissected from dormant ‘IS9530’ caryopses (37 DAP) after different incubation periods at 25 °C in water, 50 µm ABA or 150 µm GA3 + 4 solutions. Each data point is the mean value for two biological replicates (seeds from two different field plots). Western blots were repeated up to five times and the obtained signals were quantified and expressed as relative to time zero of incubation. Bars represent s.e. for the two biological replicates.

