
Figure 4.
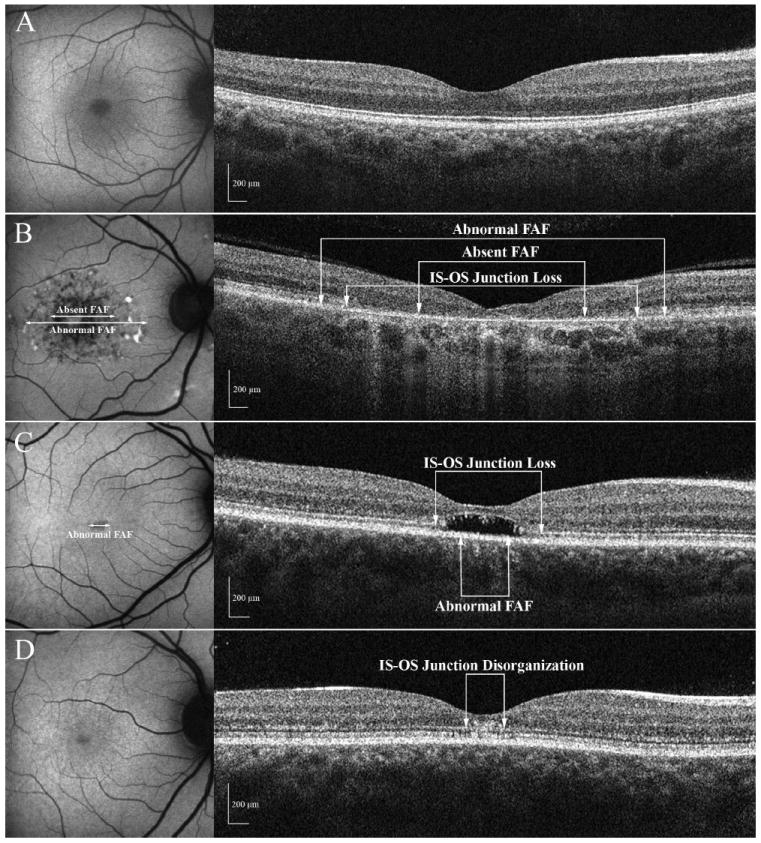
A-D: FAF and SD-OCT images for 3 patients and a normal control A. Images obtained from a control subject. B. The FAF shows an area of central atrophy and the SD-OCT image shows the loss of the IS-OS junction (Patient 6). C. The FAF shows only minimal changes and the SD-OCT image shows an area of localized loss of the photoreceptors (Patient 11) D. The FAF examination appears to be normal but disorganization of the outer retinal layers is visible on SD-OCT (Patient 10).