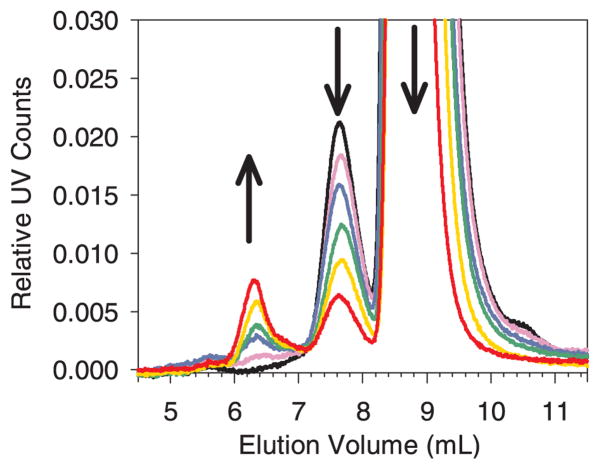
Figure 4.
Zoomed-in view of SEC chromatograms showing the increase in soluble aggregates at ~ 6.3 mL elution volume as a function stainless steel added after a 30 minute incubation with 0.1 mg/mL mAb. The y-axis scale of UV counts was normalized to the control protein monomer peak height. The arrows show the trend in peak height/area as the concentration of stainless steel was increased. This mAb initially contained ~ 2% dimer. The elution of mAb monomer was at ~ 8.7 mL, dimer/soluble aggregates at ~ 7.7 mL and soluble aggregates at ~ 6.3 mL. The baselines were flat from 0 to 5 mL elution volume. Legend: control, black line; 100 mg/mL steel, violet line; 200 mg/mL steel, blue line; 300 mg/mL steel, green line; 400 mg/mL steel, gold line; 500 mg/mL steel, red line. The color version of this figure can be accessed in the online article.

