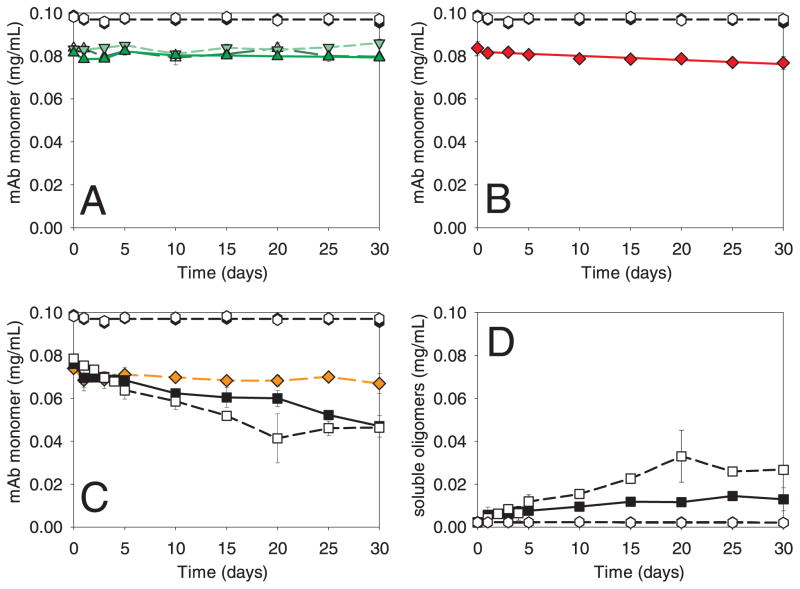
Figure 6.
Incubation of mAb with microparticles in overfilled vials without headspace (method A). Panels A, B and C show mAb monomer as a function of time. Panel D shows soluble aggregates from incubations of mAb with stainless steel. Common to all panels: un-agitated control (μ); agitated control (ν). Panel A: mAb agitated with glass vials ( ); mAb agitated with glass syringes (
 ); mAb agitated with sulfate-washed glass vials (
 ). Panel B: mAb agitated with cellulose (
 ). Panel C: mAb agitated with stainless steel (■); mAb agitated with stainless steel after passivation treatment (□), mAb agitated with Fe2O3 (
 ). Panel D: soluble aggregates after agitation with stainless steel (■); soluble aggregates after agitation with stainless steel after passivation treatment (□). Data points are means ± SD for separate triplicate samples. Error bars may be obscured by symbols. Some symbols may overlay. The color version of this figure can be accessed in the online article.

