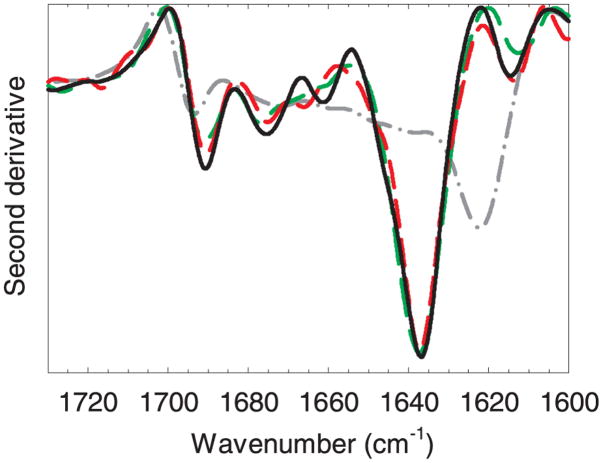
Figure 8.
Second-derivative transmission infrared spectra of mAb adsorbed to particles. Representative spectra from three replicates are shown. Legend: reference native mAb at 23 mg/mL, solid black line; boiled aggregated mAb, gray dot-dash line; mAb adsorbed to glass vials, green long-dash line; mAb adsorbed to cellulose, red medium-dash line. The color version of this figure can be accessed in the online article.

