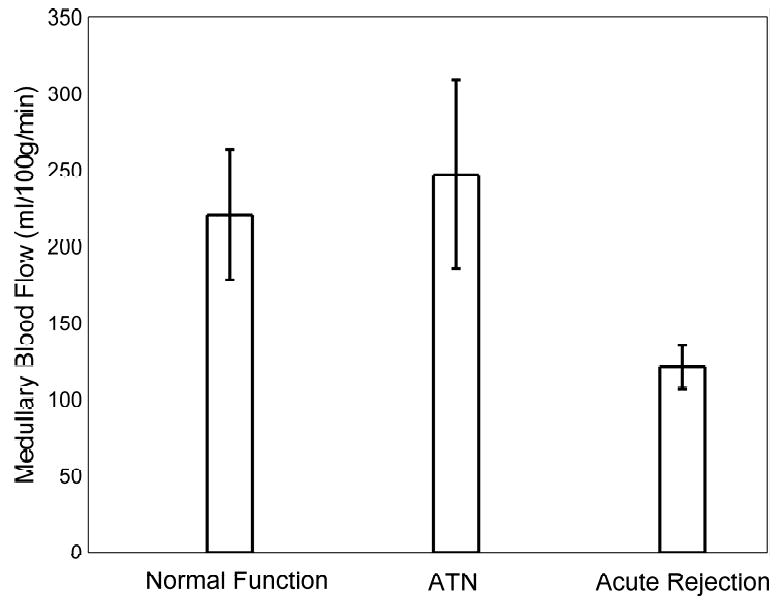
Figure 3.

Bar graph of the mean measured medullary blood flow values in transplanted kidneys with normal function, ATN, and acute rejection as measured by MRI. Note the decrease in medullary blood flow in allografts undergoing acute rejection. The difference in the mean medullary blood flow values of acute rejecting transplanted kidneys and those with both normal function (p = 0.02) and ATN (p = 0.02) are statistically significant. Error bars depict the standard error of the mean for each group.
