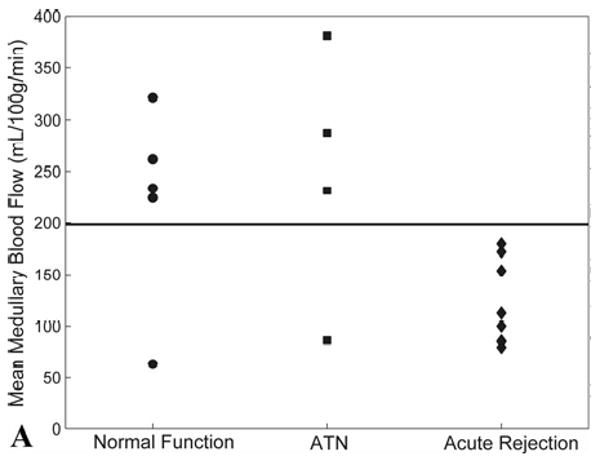
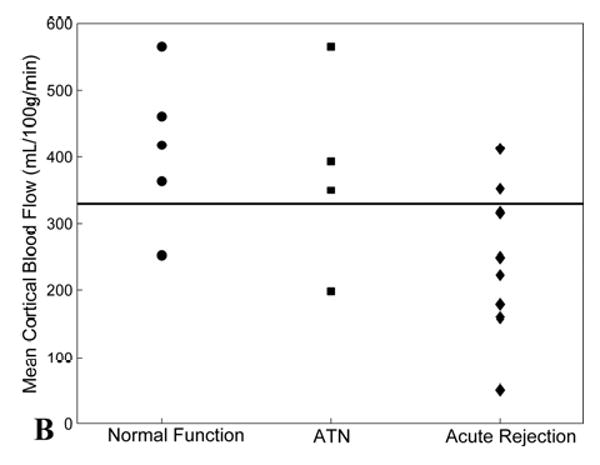
Figure 4.


(A) Scatter plot of mean medullary blood flow values measured by MRI from individual transplanted kidneys with normal function, ATN, and acute rejection. Note the blood flow in the medulla of all transplanted kidneys with acute rejection is below the threshold value of 200 mL/100g/min (solid line). Two allografts, one with normal function and one with ATN, fell below the 200 mL/100g/min threshold – these subjects were both imaged fewer than 12 days post-transplantation. (B) Scatter plot of mean cortical blood flow values as measured by MRI from individual transplanted kidneys with normal function, ATN, and acute rejection. A threshold of 325 mL/100g/min (solid line) provides the best separation of the groups although there is greater overlap compared to medullary perfusion measures.
