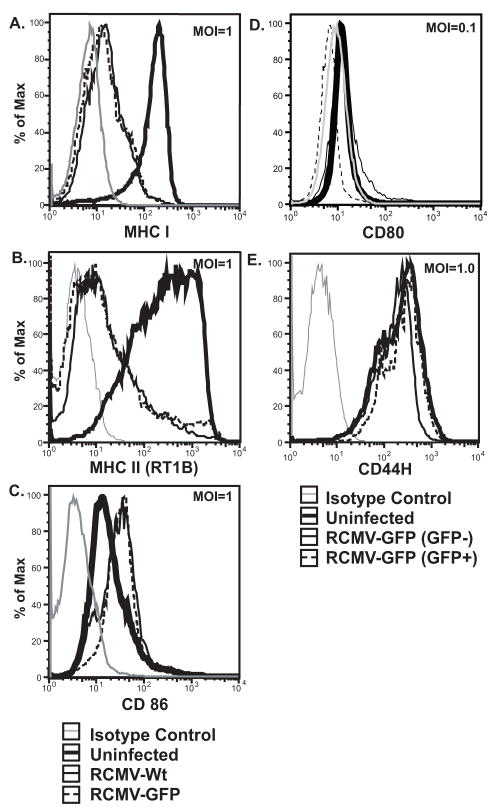
Figure 3. RCMV Down Regulates MHC I And II Cell Surface Expression.
A–C. iDCs were infected at an MOI equal to 1.0 with either RCMV Wt (thin black line), RCMV GFP (dashed black line) or mock (thick black line) for 48hrs and surface stained for MHC I (A), MHC II (RT1B) (B) or CD86 (C). Isotype controls were depicted with a thin grey line. In panels D and E, iDCs infected with RCMV-GFP at an MOI=0.1 were stained for surface expression of CD80 (D), or CD44H (E). Infected cultures were gated for GFP expression [GFP positive cells (thin dashed line), GFP negative cells (thin black line), mock treated cells (thick black line), and isotype controls (thin grey line)].

