
FIG. 4.
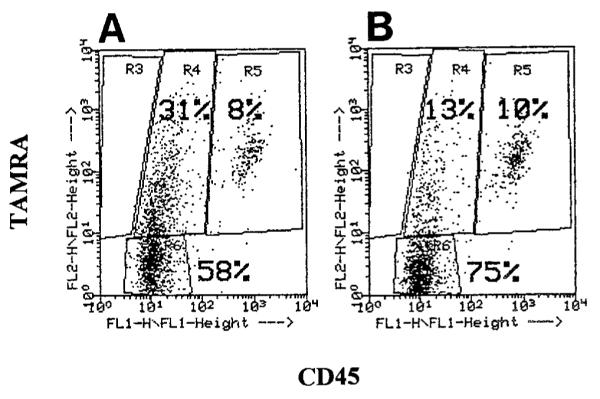
Flow cytometric dot plot (CD45 vs. TAMRA) of mHEVa cells with phagocytosed and surface-bound WEHI-231 cells. WEHI-231 cells were labeled with TAMRA, treated with anti-Ig for 24 h to induce apoptosis, washed, placed in co-culture with mHEVa cell monolayers for 24 h, indirectly immunofluorescent-labeled for CD45, and examined by flow cytometry. mHEVa cells were “gated on” in a FSC vs. SSC dot plot (Region 1) and then analyzed for the TAMRA and CD45 labels. A: mHEVa cells in co-culture with apoptotic WEHI-231 cells. B: mHEVa cells in co-culture with control WEHI-231 cells. R3 = Region 3. R4 = Region 4. R5 = Region 5. R6 = Region 6.