
Fig. 1.
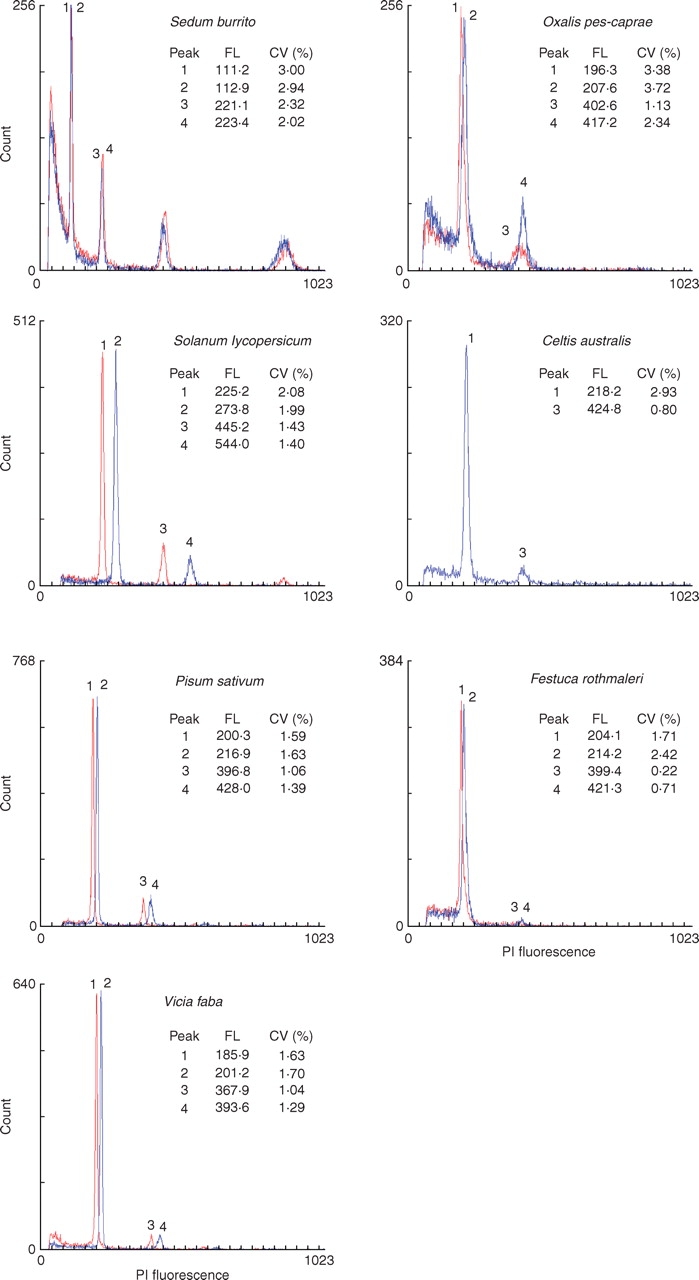
Histograms of relative fluorescence intensities (PI fluorescence, channel numbers) with overlays of distributions obtained with the general purpose buffer (GPB, red) and the woody plant buffer (WPB, blue). Mean channel numbers (FL) and coefficients of variation (CV,%) of G0/G1 (peaks 1 and 2) and G2 peaks (peaks 3 and 4) are given.