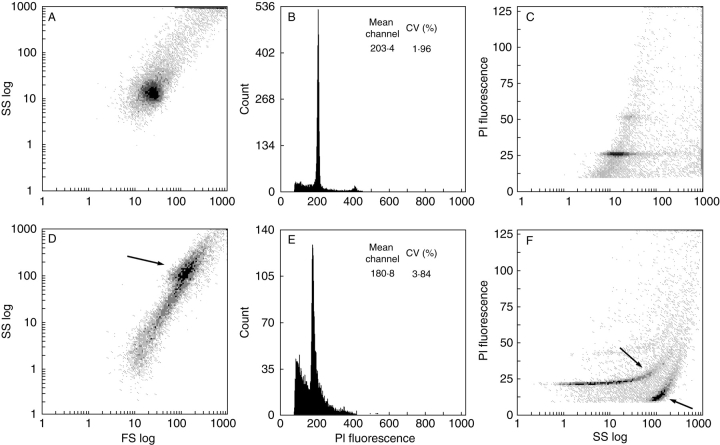
Fig. 2.
Cytograms of forward scatter (logarithmic scale, FS log) vs. side scatter (logarithmic scale, SS log) (A, D), histograms of PI fluorescence intensity (PI fluorescence, channel numbers) (B, E), and cytograms of SS log vs. PI fluorescence (C, F) of nuclear suspensions of Rosa sp. obtained with WPB (A–C) and GPB (D–F). An effect similar to the ‘tannic acid effect’ (Loureiro et al., 2006b) was observed in nuclear suspensions obtained with GPB. Arrows indicate two additional populations of particles. The first population comprises nuclei to which weakly fluorescent particles were attached (higher SS and FL values). The second population consists of clumps of weakly fluorescent particles (higher SS and lower FL values). Mean channel numbers (Mean channel) and coefficients of variation (CV,%) of G0/G1 peaks are given.

