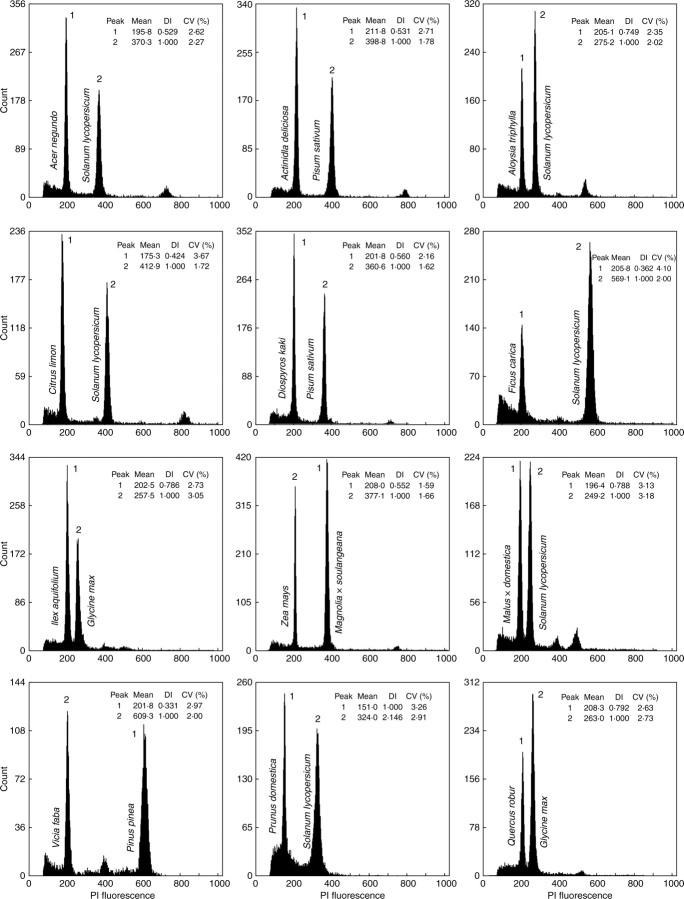
Fig. 3.
Histograms of relative fluorescence intensities (PI fluorescence, channel numbers) obtained after simultaneous analysis of nuclei isolated from sample (peak 1) and internal reference standard (peak 2) using the buffer that performed better (see Table 3). The following reference standards were used: Solanum lycopersicum ‘Stupické’ (2C = 1·96 pg DNA) (A, C, D, F, I, K); Glycine max ‘Polanka’ (2C = 2·50 pg DNA) (G, L); Zea mays ‘CE-777’ (2C = 5·43 pg DNA) (H); Pisum sativum ‘Ctirad’ (2C = 9·09 pg DNA) (B, E); Vicia faba'Inovec' (2C = 26·90 pg DNA) (J). Mean channel number (Mean), DNA index (DI = mean channel number of sample/mean channel number of internal reference standard), and coefficients of variation (CV,%) of G0/G1 peaks are given.

