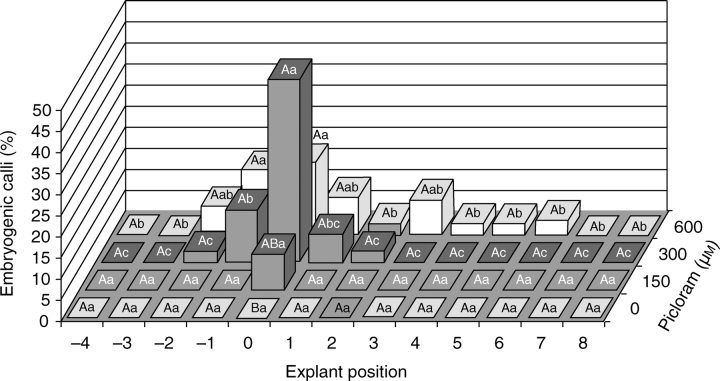
Fig. 3.
Influence of explant position and Picloram concentration (0, 150, 300 or 600 µm) on embryogenic callus production of peach palm. Upper case letters represent statistical differences among the Picloram concentrations (at each explant position) and lower case letters represent differences among the explant positions (at each Picloram concentration) according to Duncan's test.

