Fig. 4.

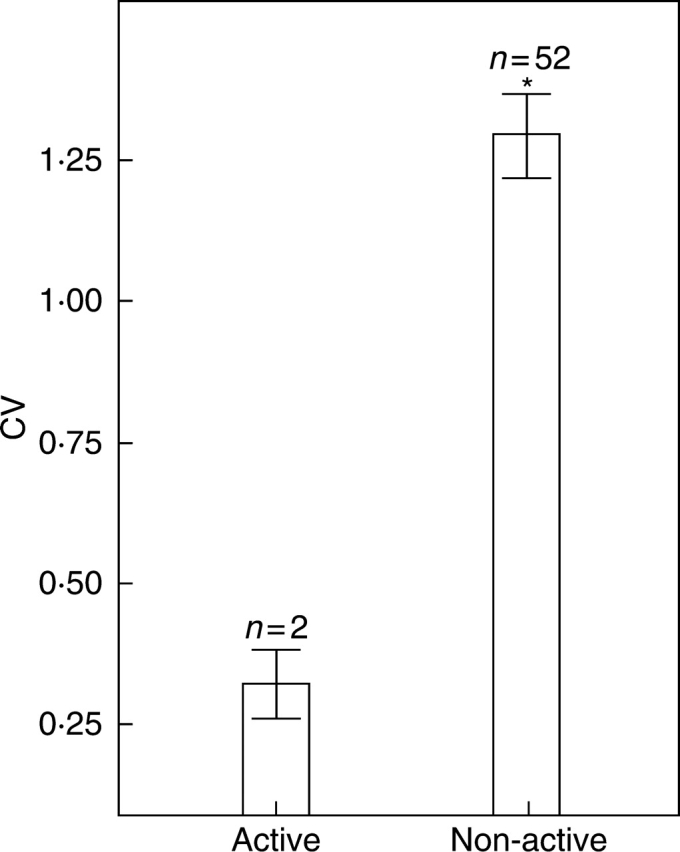
Comparison of the coefficient of variance (CV = standard deviation/mean) between the physiologically active and non-active compounds in Anacamptis coriophora. Mann–Whitney U-test, *P < 0·001). Bars show mean ± s.e.

Comparison of the coefficient of variance (CV = standard deviation/mean) between the physiologically active and non-active compounds in Anacamptis coriophora. Mann–Whitney U-test, *P < 0·001). Bars show mean ± s.e.