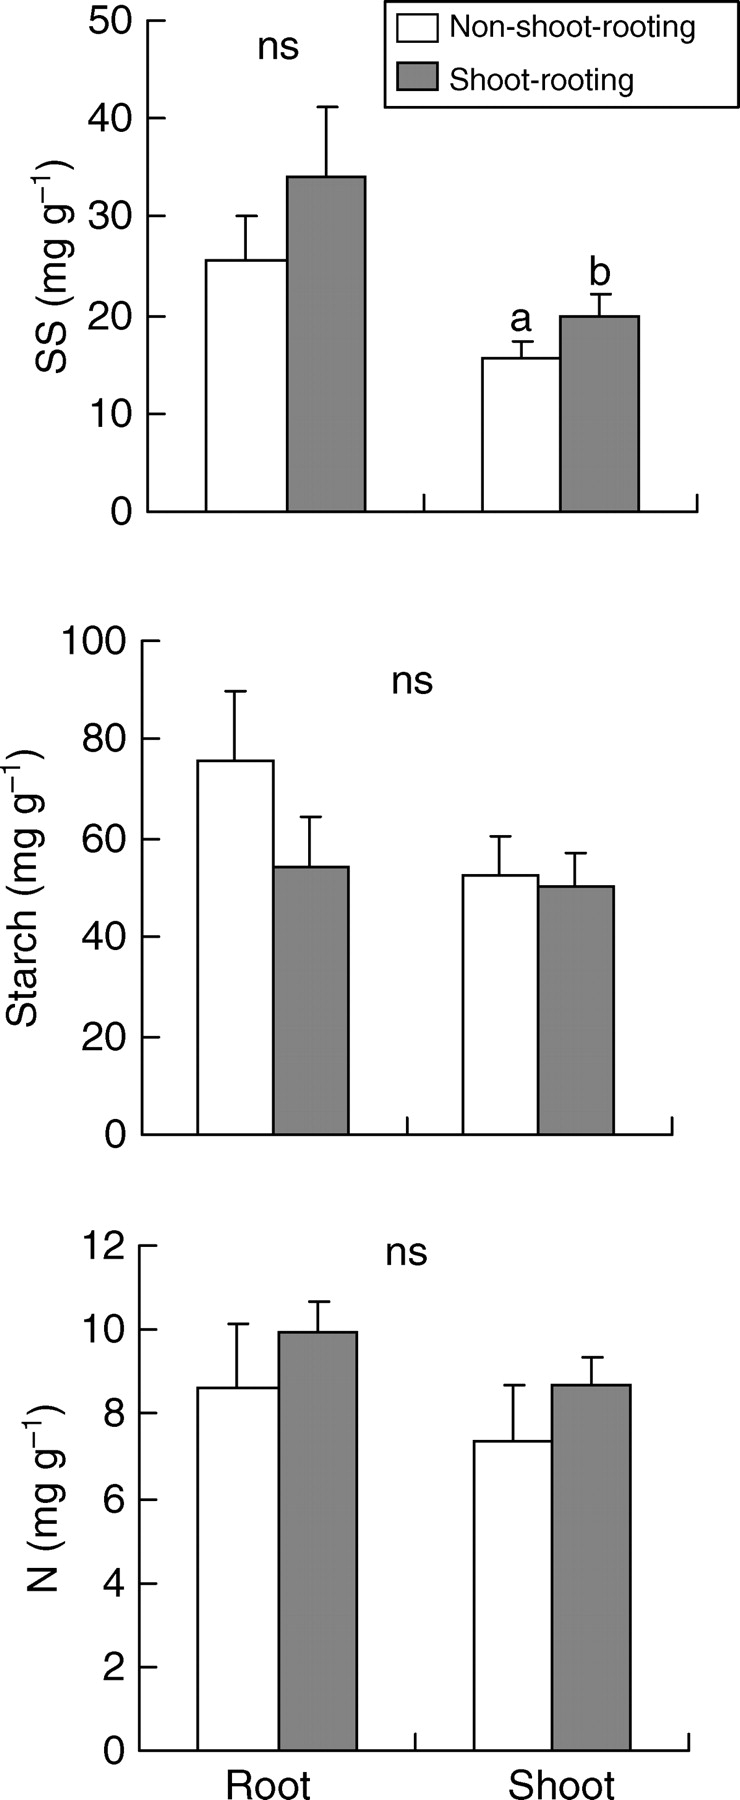
Fig. 1.

Concentrations of soluble sugars (SS), starch and nitrogen (N) in shoot-rooting and non-shoot-rooting species. Values are means +2 s.e. ns indicates no significant differences according to a nested ANOVA (P > 0·05). n = 8 for non-shoot-rooting species and n = 10 for shoot-rooting species. See text for further details on calculations.
