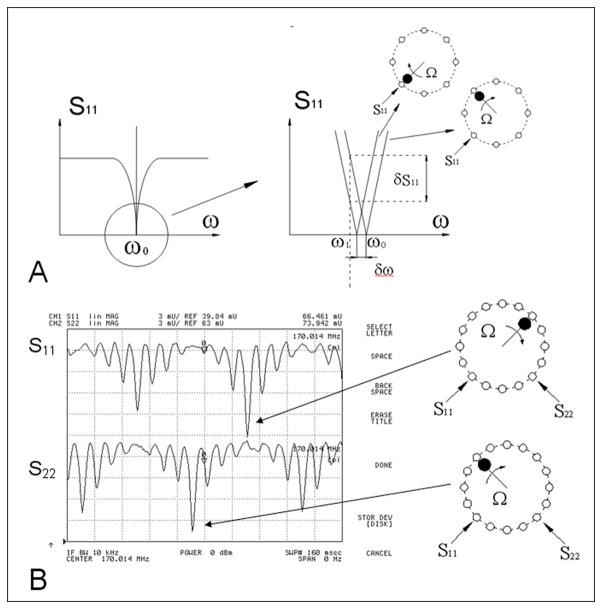
Figure 3.
A) Frequency dependence of the S11 reflection coefficient. The bottom linear part of the dependence is magnified on the right side of the figure. Two curves, measured at one of the driving ports correspond to probe positions near TEM elements with maximum (bottom element) and zero RF current (top element). The network analyzer is used in cw mode at a frequency of ω1. B) Distribution of the current in both linear channels of the TEM volume coil as observed on the network analyzer. The tuning method allows visualization of the two distributions of current for both linear modes simultaneously. The right side of the figure correlates the probe position to a corresponding peak in the current distribution.

