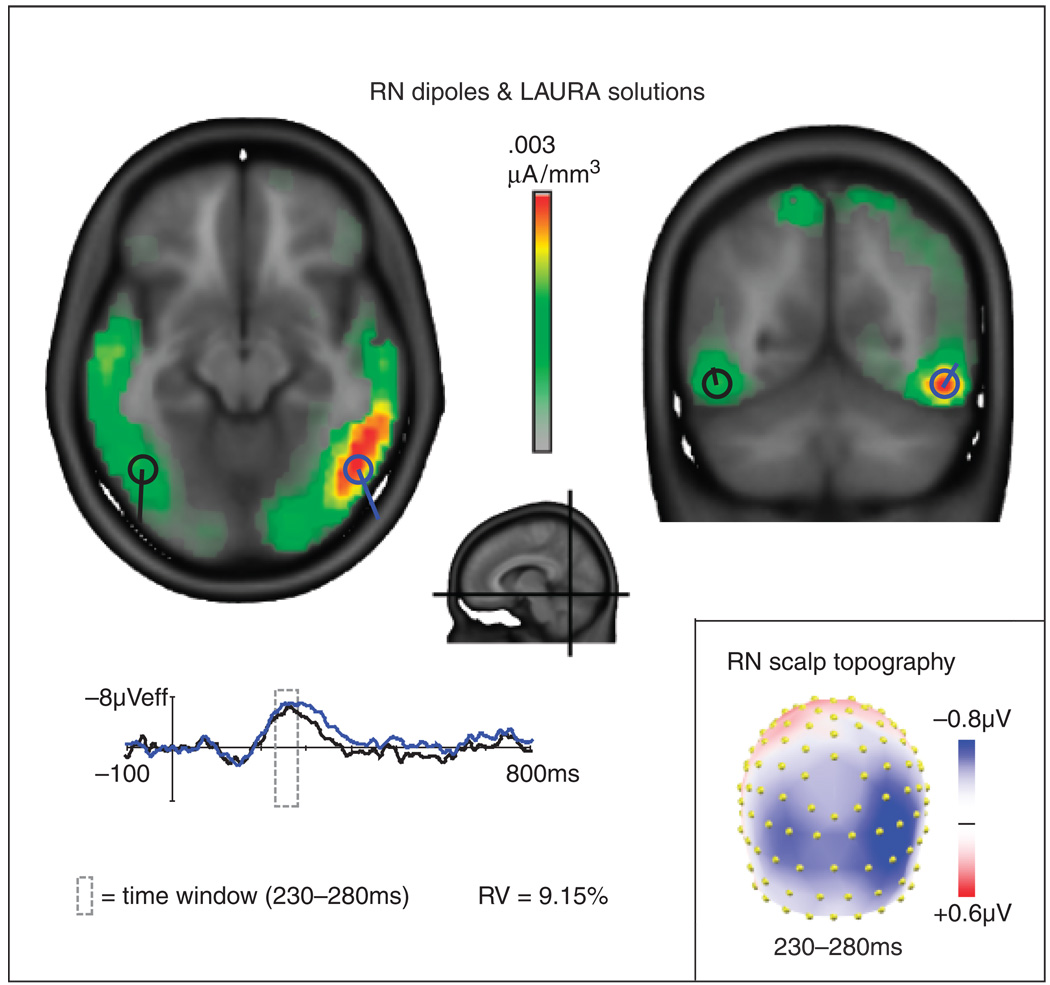
Figure 3.
Grand average LAURA source estimations for the reversal negativity (RN) component (red, orange, yellow, and green areas) and superimposed dipoles and dipole source waveforms for the left (black) and right (blue) hemispheres. Planes of the horizontal and coronal slices are indicated in the central midsagittal image. The orientations and source waveforms of the RN dipoles were calculated to best fit the difference wave distributions across a 230–280-ms time window. RV: residual variance of the two-dipole model in this interval. The scalp topography map of the difference waves (bottom right) shows voltage averaged across the time window (230–280 ms) for the RN and served as the basis for the LAURA and dipole solutions.

