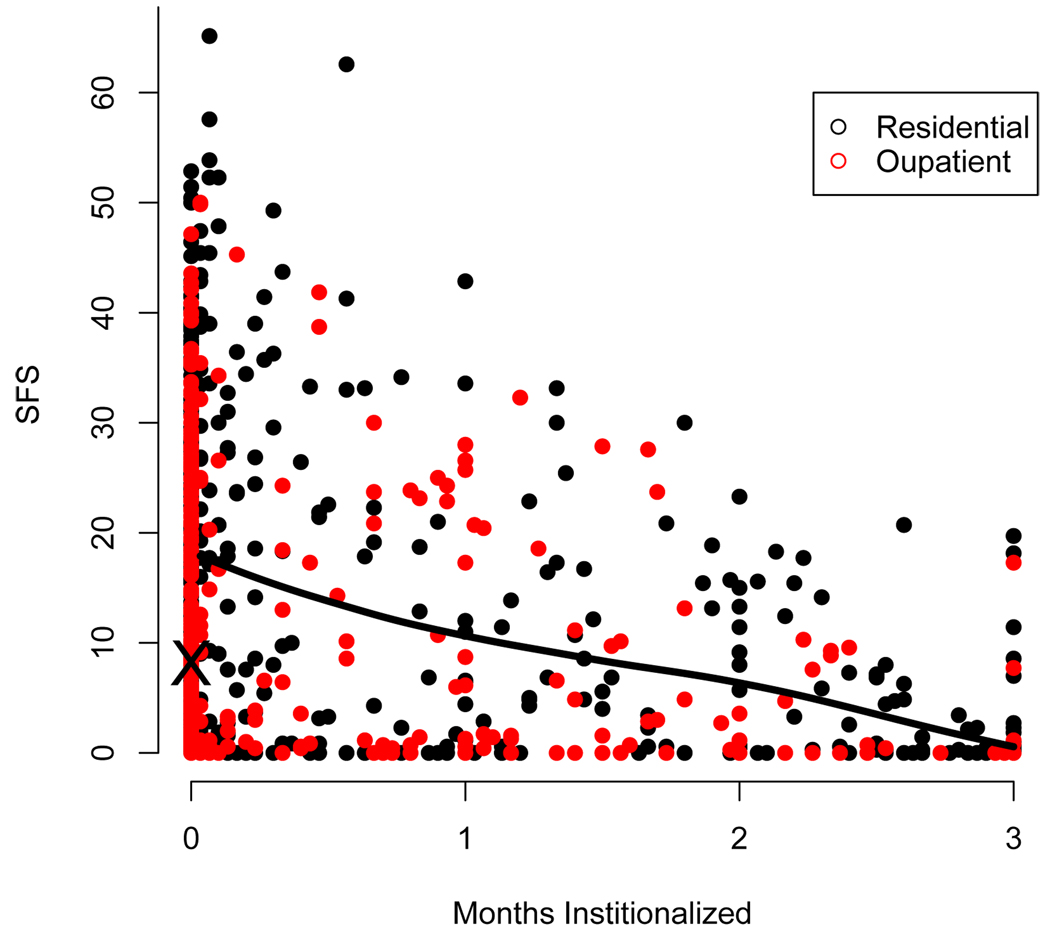
Fig. 1.
Scatter plot of SFS values by number of months institutionalized for adolescents in both residential and outpatient treatment modalities with smooth of mean SFS by months institutionalized overlayed. The black X denotes the mean SFS value among adolescents with 0 days of institutionalization.

