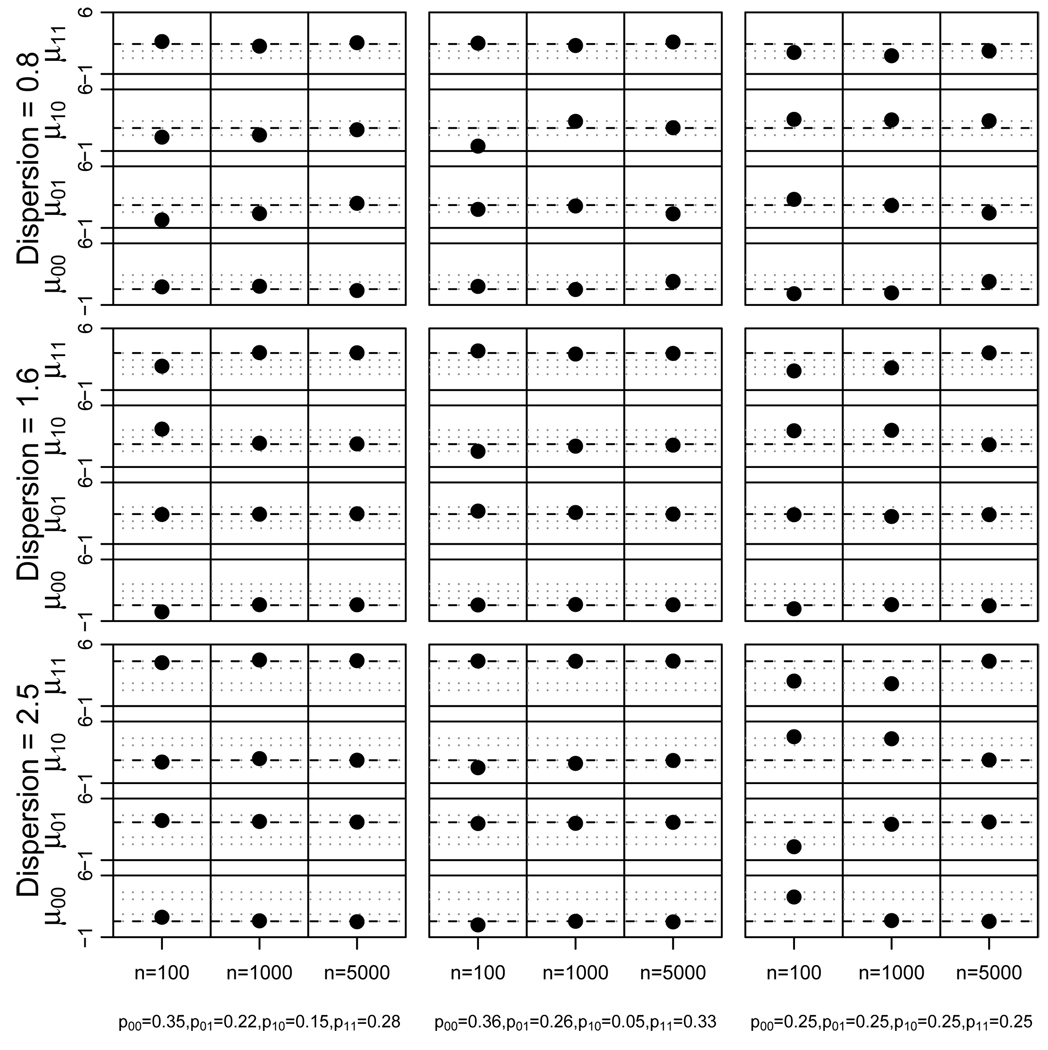
Fig. 5.
Simulation results. Plot of fitted means (black dots) versus true values (indicated by dashed lines) for the four strata in the treatment group with means for other strata (indicated as dotted gray lines) for N = 100, 1000, and 5000, different dispersions of the means, and different assumptions about the strata probabilities.

