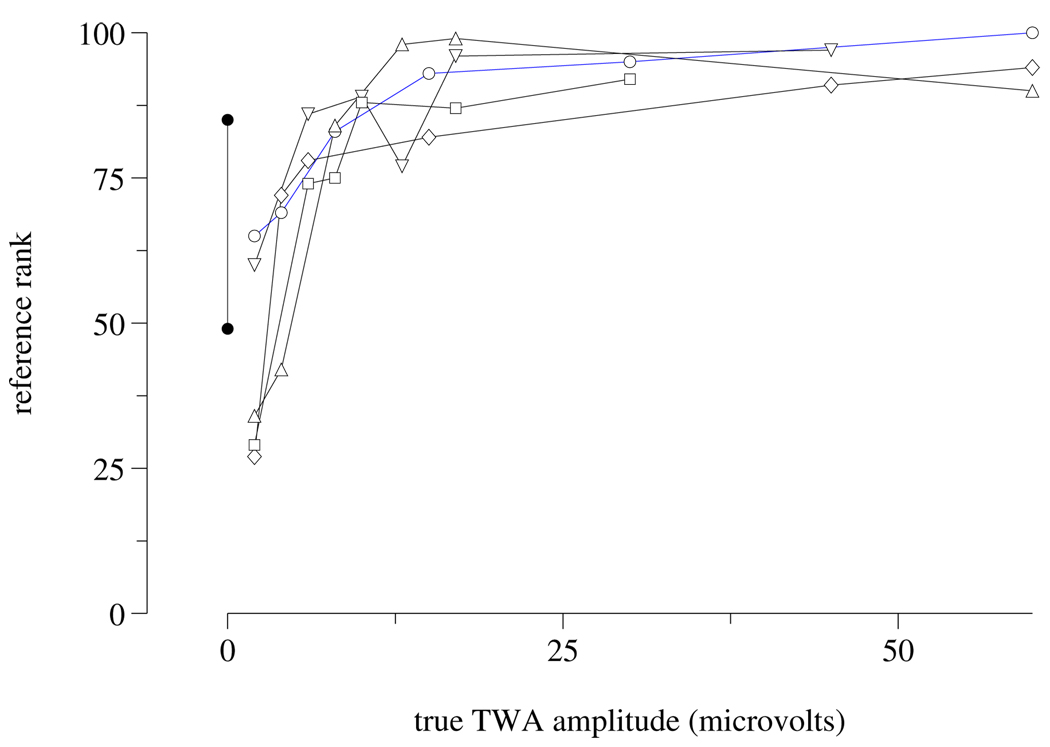
Figure 2.
Reference rank vs. known TWA amplitudes in the synthetic subset. As in figure 1, data for ECGs of the same “subject” are connected. Negative slopes reflect estimation inconsistencies that are shared across a majority of the 19 entries used to determine the reference ranks. Since the ordinates are ranks rather than measurements, non-linearity reflects the non-uniform distribution of TWA amplitudes across the entire challenge data set.

