
Fig. 1.
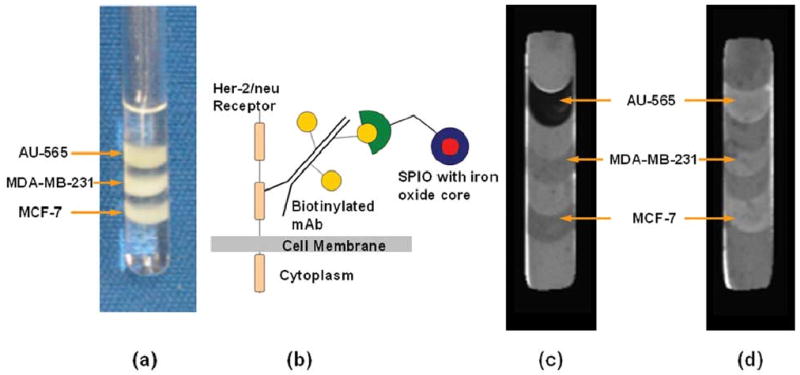
AU-565, MDA-MB-231, and MCF-7 breast cancer cells were layered in agarose gel and (a) photographed in a 5-mm NMR tube. Cells express different levels of the HER-2/neu receptor which is overexpressed in 25% of breast cancers. Receptor expression levels were 2.7 × 10⁶ for AU-565 cells, 8.9 × 10⁴ for MCF-7 cells, and 4 × 10⁴ for MDA-MB-231 cells. (b) Receptors were prelabeled with either the biotinylated immunotherapeutic agent Herceptin or a nonspecific biotinylated mAb as control. Cells were subsequently probed with streptavidin-SPIO microbeads. Eight T2-weighted MR images were used to obtain T2 maps of cell samples, with an 8-s relaxation delay and TE values of 20–250 ms. T2 maps show contrast in (c) Herceptin-labeled cancer cells, whereas no additional T2 contrast was observed in (d) controls.