
Fig. 2.
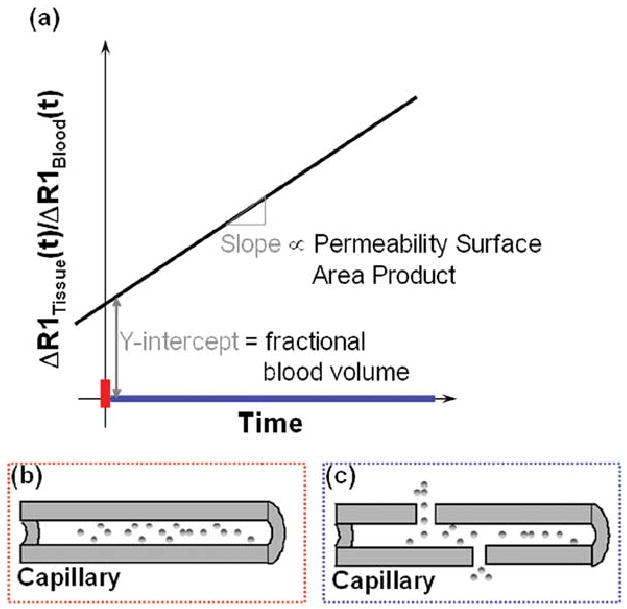
Schematic illustrating that (a) initially (red bar on time axis), the bulk of the T1 relaxation effect is proportional to the intravascular space since the CA is confined to this space. Ratio of the change in relaxation rate of the tissue Δ(l/T1tissue(t)) to that in the blood Δ(l/T1blood(t)), at t = 0, yields the fractional blood volume in that voxel (b) Blood vessel in which the macromolecular CA is initially (red bar on time axis) confined to the intravascular space. Over time (blue bar on time axis), as the CA extravasates into the adjoining tissue, the rate of change of the normalized relaxation rate Δ(l/T1tissue(t))/Δ(l/T1blood(t)) becomes proportional to the permeability–surface area product for that vessel (c) In the case of a leaky tumor vessel, for example, the CA extravasates into the adjoining interstitial space due to the elevated vessel permeability. Color of the rectangles in (b) and (c) correspond to the color of the appropriate time intervals (on the time axis) of the MR measurement.