
Fig. 3.
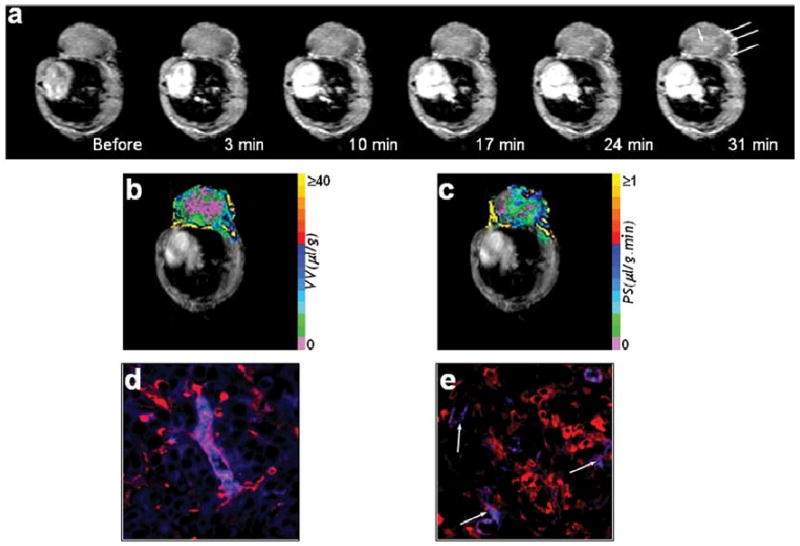
(a) Raw 1-s saturation recovery MR images obtained from a single slice of an MCF-7 tumor, at different experimental time points. Contrast uptake in the tumor is evident from the increased signal intensity (see regions marked by arrows). Maps of (b) vascular volume and (c) permeability–surface area product derived for this slice. High magnification (40×) fluorescent microscopy images demonstrating (d) a nonleaky tumor blood vessel (stained red) with the albumin-GdDTPA (stained blue) within its lumen and (e) highly permeable vessels (stained red) with the albumin GdDTPA (stained blue) extravasating from their incomplete or leaky lumens (indicated by arrows).