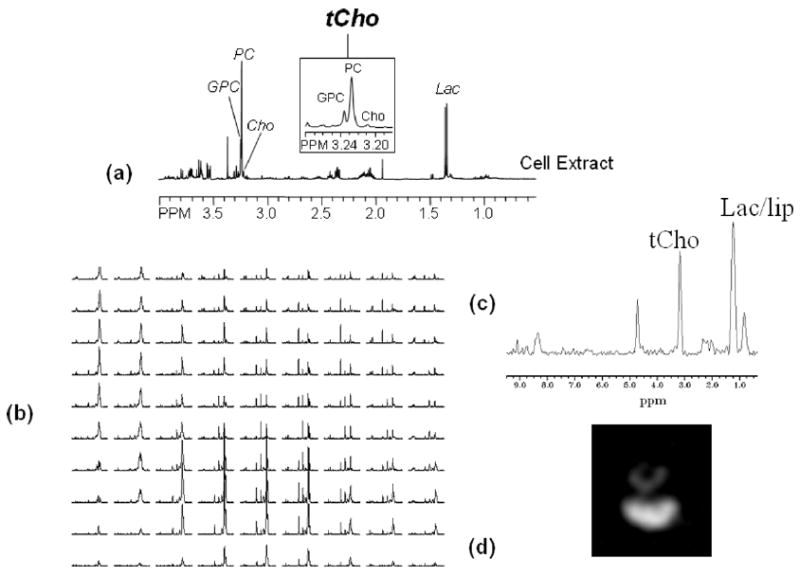
Fig. 4.

1H MR spectra showing (a) high resolution spectrum of a perchloric acid cell extract. Zoomed region around 3.2 ppm shows high levels of PC and total-choline containing metabolites and low levels of GPC in human breast cancer MDA-MB-231 cells (see inset). (b) Proton CSI spectra obtained from 1 × 1 × 4 mm voxels from an MDA-MB-231 tumor (vol. = 500 mm3) with TE = 272 ms, TR = 1 s, and the total acquisition time = 25 min. (c) Spectrum obtained from a representative 1 × 1 × 4 mm single voxel showing total choline and lactate/lipid. (d) Total choline map derived from the total choline signal in the CSI data set demonstrating the heterogeneity of metabolite distribution within the tumor. Following peaks are assigned in the 1H MR spectra: Cho, free choline; GPC, glycerophosphocholine; Lac, lactate; Lac/lip, lactate+lipids; PC, phosphocholine; tCho, total choline-containing metabolites (Cho + GPC + PC).
