
Fig. 5.
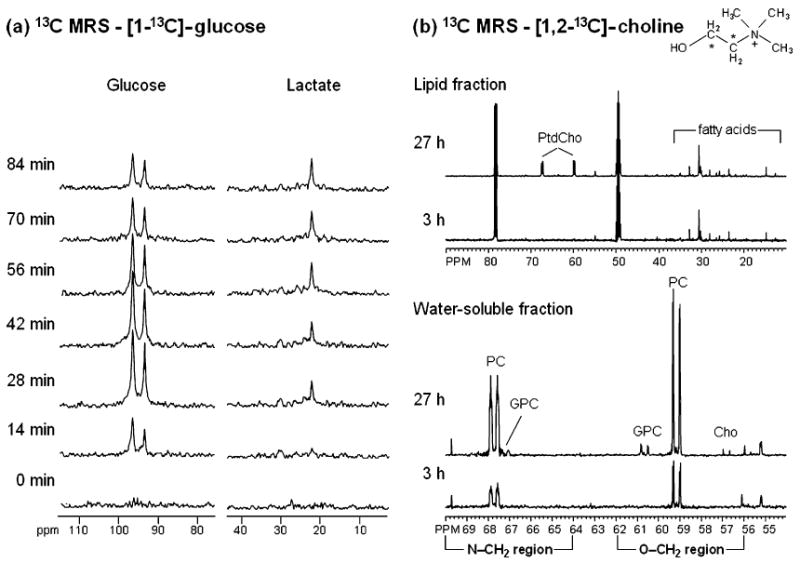
(a) In vivo13C MR spectra of a RIF-1 tumor obtained at 400 MHz using heteronuclear cross polarization following intravenous administration of 900 mg/kg [1 – 13 C]-glucose. Glycolytic rate of the tumor can be determined from the kinetic analysis of 13C-lactate build-up. (b) Representative 13C MR spectra from MDA-MB-231 cells labeled with 100 μM [1, 2 – 13 C]-choline (13C labels are indicated by asterisks in the choline structure schematic) for 3 or 27 h. Cells were extracted using a dual-phase extraction method and 13C MR spectra were obtained from the water-soluble fractions and the lipid fractions at both time points. The 27-h time point shows metabolites derived from a combination of biosynthetic and breakdown pathways. At this time point, the 13C label was detected in glycerophosphocholine (GPC), phosphocholine (PC), and free choline (Cho) in the water-soluble fraction and in membrane phosphatidylcholine (PtdCho) in the lipid fraction. At the 3-h time point 13C labeling was incorporated only through the biosynthetic pathways of choline membrane metabolism. Labeling of PtdCho did not occur at this time point; therefore, the contribution of the 13C label from PtdCho breakdown pathways was not detectable.