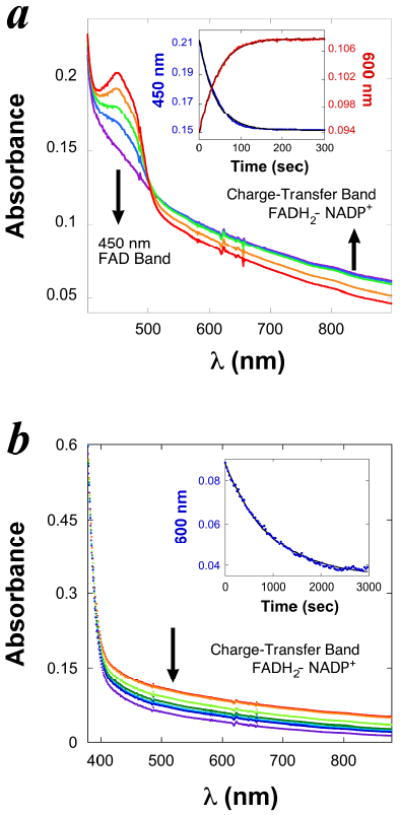
Figure 2. The kinetics of FADH2-NADP+ charge-transfer complex during the reductive half reaction of FDTS.

a. Spectra of 10 μM (active site concentration) tmFDTS-FAD being reduced anaerobically by 200 μM NADPH in 200 mM Tris/HCl buffer (pH 7.9) at 37 °C. Each spectrum was sampled at a different time during one single-turnover experiment. The absorbance of FAD (450 nm) decreases as the charge-transfer band of the FADH2-NADP+ complex (550 - 900 nm) increases. Inset: A typical time course of the enzyme-bound FAD reduction by NADPH. The decrease of absorbance at 450 nm is presented as red traces, and the increase of the charge-transfer band from 550 nm to 900 nm is presented as blue traces. Fitting each time course (black curves in the inset) to an exponential equation yields a first-order rate constant, both equal 0.025 ± 0.002 s-1. b. Continuation of the experiments described in panel a., but the first spectrum was recorded after the last one in panel a., and the spectra were recorded in intervals of 30 min. The wide charge-transfer band disappears slowly while the enzyme remains reduced and with no change in total enzyme concentration (as judged from absorbance at 230-300 nm range). The decrease in charge transfer bend is interpreted as NADP+ release. The inset presents the exponential fitting (black curve) of the time course of absorbance change at 600 nm (blue traces). The first-order rate constant of disappearance of the charge-transfer band was determined to be 0.00135 ± 0.00005 s-1.
