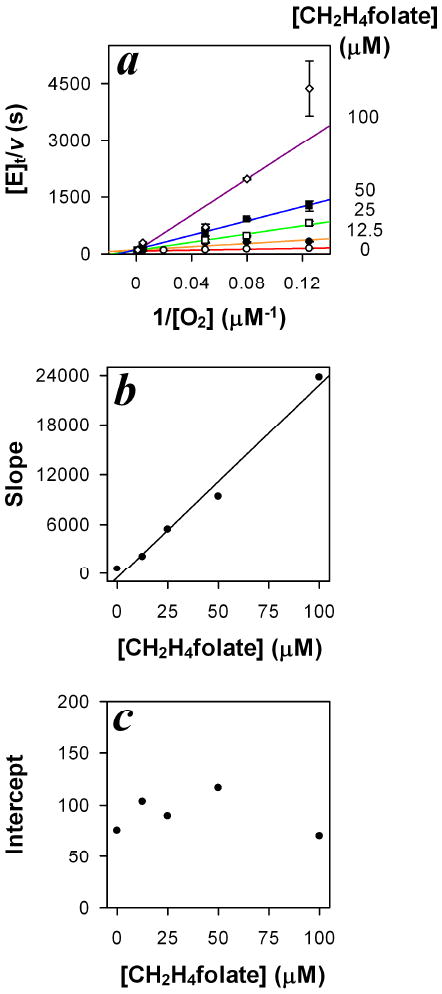
Figure 3. Competitive inhibition of FDTS oxidase activity by CH2H4folate.

a. The Lineweaver-Burk double reciprocal plot (1/rate vs. 1/[O2]). CH2H4folate concentrations used were (○, red line) 0 μM, (λ, orange line) 12.5 μM, (□, green line) 25 μM, (ν, blue line) 50 μM, and (◊, purple line) 100 μM. b. The secondary slope-replot of the Lineweaver-Burk plot (a), which increases linearly with [CH2H4folate]. c. The secondary intercept-replot of the Lineweaver-Burk plot (a), which is independent of [CH2H4folate]. Experiments were performed at 37 °C.
