
Figure 1.
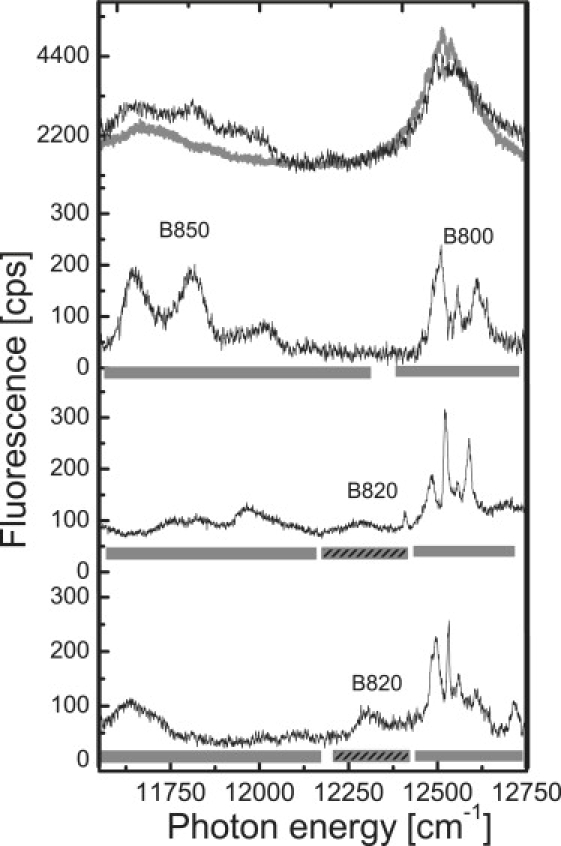
Low-temperature (1.4 K) fluorescence-excitation spectra of LH2 complexes from LL Rps. palustris 2.1.6. The top traces show the spectrum from an ensemble (gray line) and the spectrum that corresponds to the sum of 31 spectra from individual LH2 complexes (black line). The lower three traces display typical fluorescence-excitation spectra from individual LH2 complexes. The spectra have been averaged over all polarizations of the incident laser field. The bars indicate the spectral positions of the 800, 820, and 850 nm bands, respectively. The excitation intensity was 50 W cm−2. The vertical scale is given in counted photons per second (cps).