
Figure 4.
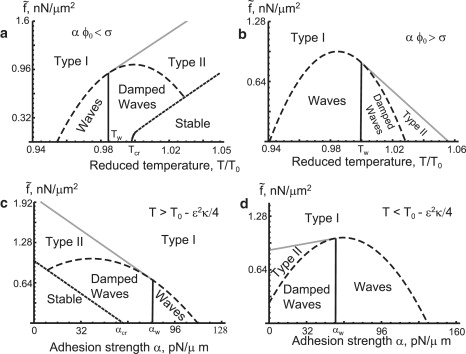
(a) The phase diagram of our model, on the plane of versus T, with B = 20.48 pN/μm2 s and α = 48 pN/μm < σ/ϕ0, i.e., adhesion weaker (on average) than the surface tension, so a mixed state exists. (b) The same diagram, but with α = 72 pN/μm > σ/ϕ0 and B = 19.2 pN/μm2 s, i.e., adhesion stronger (on average) than the surface tension, hence there is a phase separation for all T. (c) Phase diagram on the plane of versus the adhesion strength α, with B = 20.48 pN/μm2 s and T = 1.005 > T0 − ɛ2κ/4, a mixed state exists. (d) The same diagram, but with B = 20.48 pN/μm2 s and T = 0.99 < T0 − ɛ2κ/4, the phases separate for each α. In panels a–d, the term “Waves” indicate waves-instability (propagating waves).