
Figure 6.
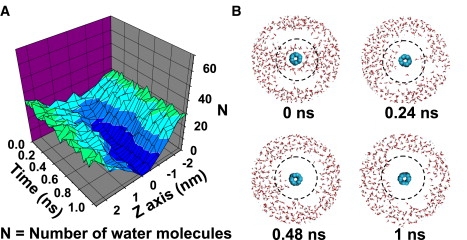
Dehydration process of SWNT-Aβ octamer interface observed in run 9. (A) Time evolution of the number of water molecules within each cylinder along SWNT-axis. The cylinder is 1.0-nm thick from SWNT-axis and 0.5 nm high. (B) Four snapshots of SWNT(3,3)-octamer-water (view parallel to SWNT-axis) generated within the first 1 ns. To visualize the dehydration process clearly, a radius of 1 nm from the SWNT-axis is drawn in dotted line, the Aβ octamer is omitted and only the water molecules within 2 nm from the SWNT-axis are displayed.