
Figure 1.
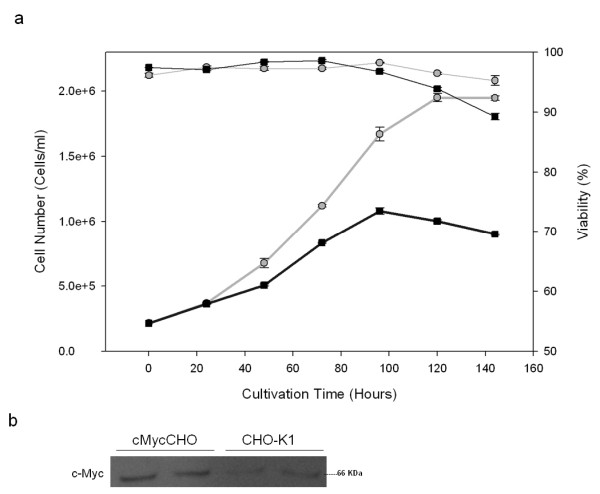
Batch cultivation of cMycCHO. The growth curve (a) of cMycCHO (grey circles) compared to CHO-K1 (Black squares). This culture seeded and grown (n = 3) in parallel, as a control for the BrdU pulse labeled cultures shows that cMycCHO (maximum cell density 1.99 × 10⁶ cells/ml) has an increased proliferation capacity compared to the CHO-K1 (maximum cell density 1.1 × 10⁶ cells/ml). (b) Western analysis of biological duplicate samples with c-Myc over-expression observed in the cMycCHO cell lines.