
Figure 2.
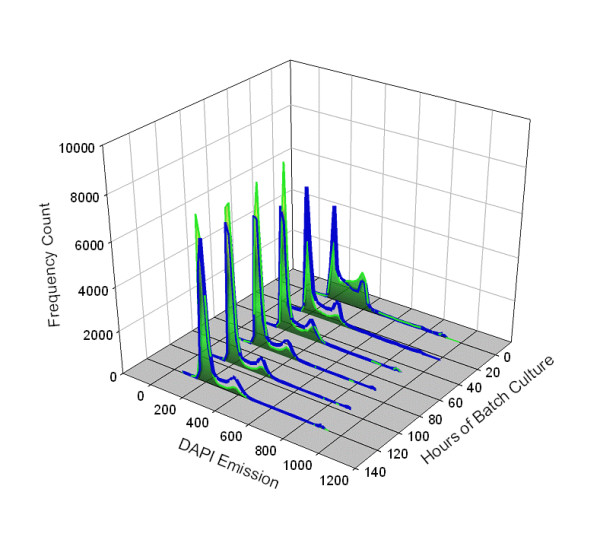
A histogram of the cell cycle phases for cMycCHO versus CHO-K1 culture. cMycCHO is represented by the non-shaded cell cycle profile (blue profile line) while the CHO-K1 profile represented by a shaded area underneath the histogram. It can be seen that the percentage frequency of the G1/G0 region in the 200 channel emission spectra decreases below CHO-K1 as the culture progresses while the S-phase (between 200 and 360 emission channel) and G2/M (at ~360 emission channel) is consistently greater with culture time for cMycCHO.