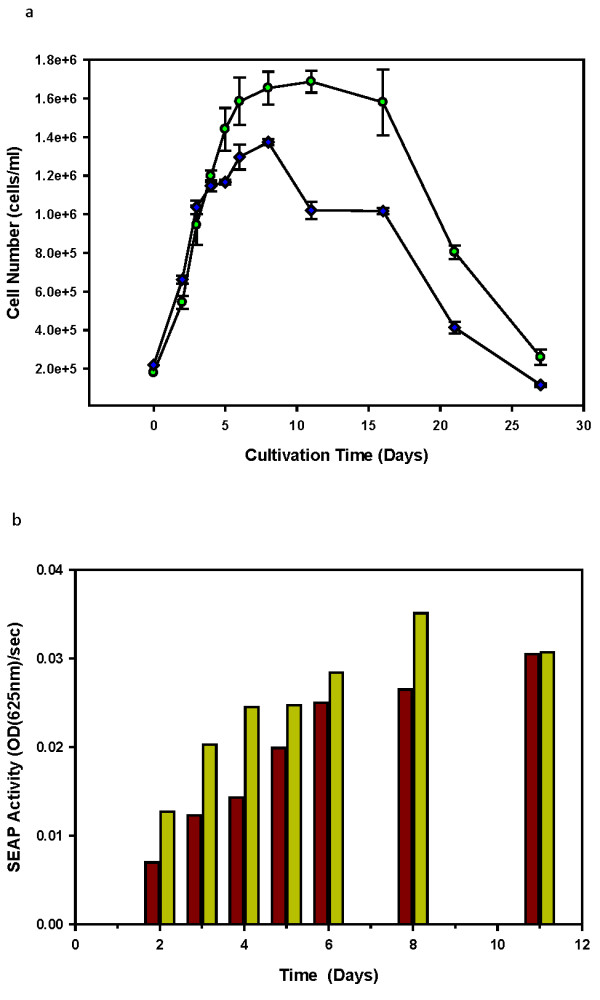
Figure 8.

Batch Cultivation of CHO95 versus CHO80. This is represented by the growth curve (a) of CHO80 (blue diamonds) and CHO95 (green circle) cell line (n = 3) including the (b) SEAP activity of CHO80 (yellow bar) versus CHO95 (brown bar) measured from the supernatant by kinetic analysis of 625 nm absorbance through 60 second intervals for 50 minutes for time points representing the culture progression from exponential phase to the start of the death phase.
