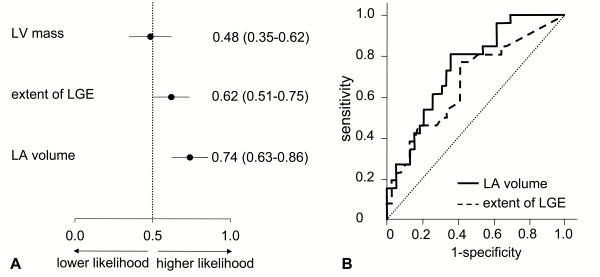
Figure 1.
Receiver operating characteristic (ROC) curve analysis of left ventricular mass, extent of late gadolinium enhancement (LGE) area and left atrial volume as a predictor of AF. In the panel A, mean area-under-curve with 95% confidence intervals are presented. In the panel B, ROC curves are presented of extent of LGE and left atrial volume to determine optimal cut-off values. LA = left atrial, LV = left ventricular, LGE = late gadolinium enhancement.

