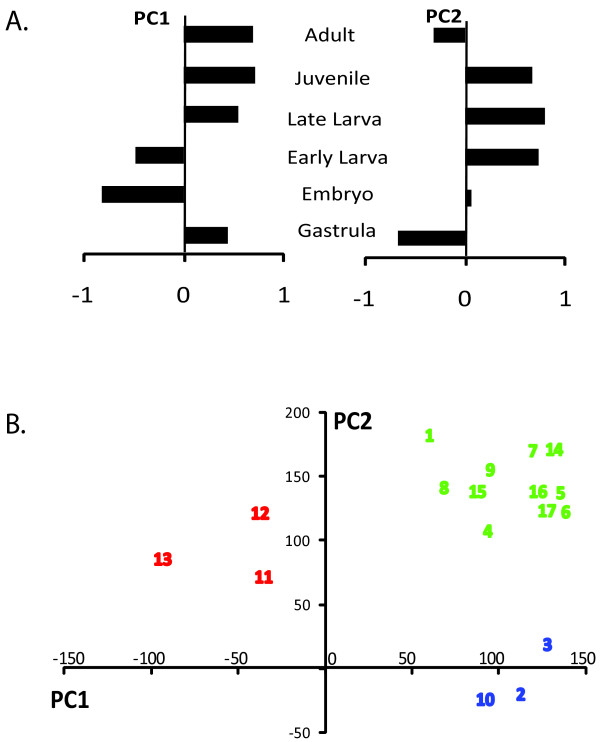
Figure 5.
Principal components analysis of nuclear receptor relative expression data. Analysis was conducted on gene expression normalized to the maximum expression for each gene, as in Figure 4A. (A) Eigen vectors showing relative contribution of each life stage to each principal component. Longer bars indicate stronger relative contribution. The first and second principal components explained 39% and 36% of the variance, respectively. (B) Scatter plot of first and second principal component scores for all seventeen nuclear receptors. Colors indicate three distinct clusters of NRs showing similar expression patterns. Numbers 1-17 indicate N. vectensis nuclear receptors 1-17, respectively.

