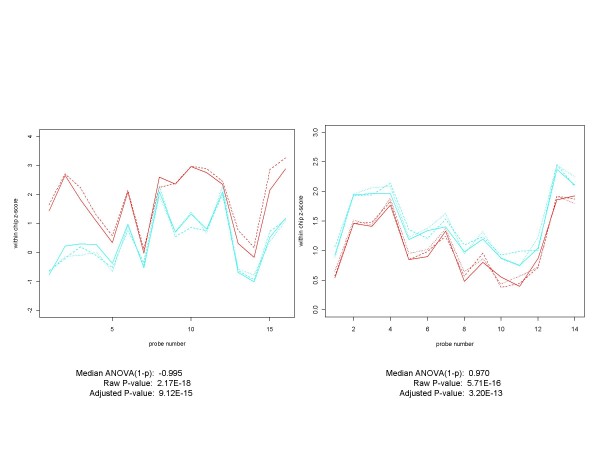
Figure 15.
Plots of Unanticipated Positives from HG-U95A and Golden Spike Experiments. Unanticipated positives occur in all three spike-in experiments. Here are examples from each of the HG-U95A (on the left) and the Golden Spike (on the right) experiments. The non-spiked-in HG-U95A gene 32660_at ranks 2nd out of 14010 genes (14 of which were spiked-in) in the experimental conditions C (replicates in red) vs. D (cyan) comparison for RMA, PLM and both of the median ANOVA (1-p) measures. For the Golden Spike plot, the non-spiked-in gene 142245_at ranked 23, 24, 177 and 66 according to median ANOVA (1-p), median signed ANOVA (1-p), RMA and PLM respectively, out of a total of 14010 probe sets, of which 1331 were designated as spiked-in. Plots for control arrays are in red, those for spiked-in arrays in cyan. In both cases the plots and p-values do not appear to be compatible with the hypothesis that they came from probe sets with identical probe-level distributions across conditions.

