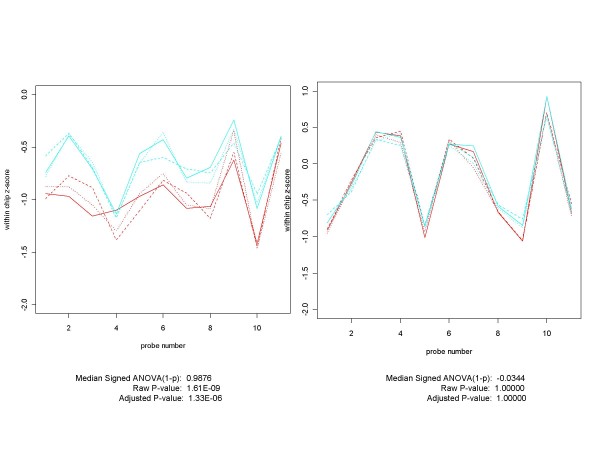
Figure 17.
Plots of comparisons involving lowest concentrations -- One differentially expressed, the other not. These two genes, AFFX-r2-TagE_at (on the left) and 205790_at (on the right) are each spiked in at the lowest concentration (0.125 pM) in the Affymetrix HGU-133A Latin Square experiment. When this condition (in cyan) is compared with the non-spiked-in condition (in red), AFFX-r2-TagE appears to be differentially expressed while 205790_at does not. Using genes at low concentrations for assessing the effectiveness of differential expression algorithms presents some unique challenges. Sometimes, as for AFFX-r2-TagE, the gene is differentially expressed in the CEL files, in which case it is a suitable candidate for evaluating data analysis procedures. Frequently, however, as illustrated by 205790_at, the effect of the small initial difference in concentrations is wiped out by the many processing steps that occur on the way to creating CEL files. What results is a gene that is not differentially expressed at the CEL file level. It may be no easy task to identify which genes fall into which category.

